Showing posts with label analysis. Show all posts

17 June 2009

AirAsia 2008 - Operational Cashflow still Strong.

Due to its weak performance in 2008, the shareholders of AirAsia had been worried about its gearing and coverage ratios.

This article is just a simple analysis on AirAsia's 2008 cashflow, which is an important measure of the company's ability in servicing its debts.

According to its audited account, AirAsia's cashflow from operation in 2008 is negative RM 416 million. This number, however, is what we get after charging the unwinding loss on derivatives. Seeing that the huge cash outflow of this unwinding process is not neccesarily to be recurring, we should exclude them from our analysis so that we can get a more accurate picture on AirAsia's real performance.

How much cash had AirAsia actually paid in the unwinding transactions? According to its report, the total unwinding loss incurred is RM 1.1 billion. The loss is allocated and borne by three entities of AirAsia:

  • AirAsia Malaysia: RM 679 milion
  • Thai AirAsia: RM 222 million
  • Indonesia AirAsia: RM 207 million.

Among these losses, only the RM 679 million is reflected in AirAsia's income statement. I believe, however, that the cash outflow of RM 1.1 bllion is all paid from within AirAsia. This is because the two oversea entities have no enough cash to settle those transations -- their operation are still in loss position, and their equities are negative. And from the statements of AirAsia, we can see that more than RM 500 million of cash was injected into these entities by AirAsia in 2008.

dl_01wallpaper1024

Thus, instead of RM 679 milion, the total amount of RM 1.1 billion should be used for our adjustment on AirAsia's cashflow. After the first adjustment, the operational cashflow of AirAsia had become a positive RM 691 million.

Then, due to the reason discussed in my previous post (regarding the recurring nature of the fuel-hedging transactions), I'll charge back a cash outflow of RM136 million (equal to 20% of RM679 million) into AirAsia's cashflow account. After this second adjustment, AirAsia's operational cashflow of 2008 would be a positive RM 555 million.

* This figure is from the perspective of AirAsia company only. Because I can't get the information on the cashflows of TAA and IAA, analysis from the level of whole AirAsia Group can't be done.

Compared to the company's cash outflow on interest (RM 240 milion) and repayment of borrowing (RM 301 million), the operational cashflow can be considered as strong, and its cashflow ratios is within my comfort zone.

However, this cashflow performance is still below my initial expection. In 2009, I hope that AirAsia can make a huge improvement, generating an operational cashflow of no less than RM 1 billion.

16 June 2009

Dissecting AirAsia's Earning 2008 (Part2)

Here, we examine AirAsia's financial performance, taking into account the profit/loss from Thailand AirAsia (TAA) and Indonesia AirAsia (IAA).

Revenues of the jointly-control-entity & associates in 2008:

  • TAA: RM 889 million
  • IAA: RM 482 million*
And their results are:
  • TAA: RM -118 million
  • IAA: RM -83 million*

* Besides IAA, AirAsia has a number of other associates. In the sense that their contribution should be quite small, I assumed that the figures of revenue/loss from associates as reported in AirAsia's statment are all derived from IAA.

The net losses stated above are after the adjustment discussed in part-1, i.e. I took out the whole unwinding loss on derivatives (RM 222 million for TAA, RM 207 million for IAA), and then charge back 20% of its amount .

The above losses are not reflected in AirAsia's reported income statement, because the associate's results are consolidated into AirAsia's statement using equity method, and their equity had become zero since few years ago. However, to gauge the economic performance of AirAsia as a grouop, these unregconized losses should be taken into account.

Consolidating the share of loss (48.9%) from these associates, AirAsia's results in 2008 will turn negative -- a net loss of RM 38 million. It should be pointed out that the shared profit/loss from the long-haul AirAsia X had not been included here. However, its contribution in 2008 should be quite small and hence negligible.

dl_c12wallpaper1024

Next, we examine AirAsia's performance from the perspective of whole AirAsia Group. Here, we consolidate 100% of TAA & IAA's revenue and results with AirAsia Malaysia. In my opinion, this is the most appropriate measure of AirAsia Group's performance. (see the reasons here.)

The figures after consolidation are:

  • Revenue: RM 4.00 billion
  • Profit/loss: RM -141 million
  • Profit margin: -3.5%

From the Group's perspective, AirAsia was suffering a loss in 2008. I'm a bit disappointed with this performance. However, the prospect of AirAsia in 2009 is very optimistic.

15 June 2009

Dissecting AirAsia's Earnings 2008 (Part 1)

dl_08wallpaper1024

As pointed out in my older posts, AirAsia's reported earnings need some adjustment before the numbers can be used to gauge its performance.

To dissect AirAsia's 2008 earnings, let's begin with the reported numbers in its Income Statement:

  • Profit before tax (PBT) : RM -869 million
  • Profit after tax( PAT) : RM -497 million
  • Earning per share: -21.1 sen

We start our analysis using PBT to eliminate the effect of deferred tax. First adjustment we had to do is taking out the non-operating gain/loss from the reported income. They are:

  • unwinding derivatives (interest-rate swaps): RM -152 million
  • unwinding derivatives (fuel hedging contract): RM -678 million
  • foreign exchange movement on borrowings: RM -235 miilion

After our first adjustment, the profit of AirAsia in 2008 is RM196 million, which is equivalent to 8.2 sen per share. Not bad so far...

But I would like to discuss further about the validity of the adjustments done. Those 3 items are excluded because they are thought to be non-recurring in nature. But are they really so?

In my opinion, the FX movement is quite volatile and the trend is difficult to predict, thus its short-term movement can be considered as non-recurring. But fuel-hedging is a different case. Every airlines in the world will more or less hedge their fuel consumption. AirAsia's current position without any hedge is just a short term bet on the movement of oil prices. Sooner or later, it will resume oil-hedging activities.

So, the unwinding decission taken by AirAsia last year, is like charging all the future loss into one year. This action will make its 2008 earning worse, at the same time inflate its future reported income (less loss from hedging).

I suggest that we charge a portion of the unwinding loss back into AirAsia's income.

According to its quarterly report (Sep-2008), the original intention of AirAsia when entering these contracts is to hedge its fuel cost in the remaining period of 2008 and year 2009. Lacking of any detail information, I think the unwinding loss of these contracts (RM 678million) should be spread evenly over the five quarters starting Q4-2008. As a result, a loss of RM136million (= 20% x RM678million) should be charged into each of these quarters to bring down the inflated earning.

As a result, AirAsia's adjusted earning in 2008 will become RM 60 million, or 2.5 sen per share.

.

09 November 2008

Get a 9% Compound Return with Minimal Risk

Few weeks ago, Burren Buffett investment in Goldman Sachs had got the attentions of Wall Street. Despite the bad economic outlook, the purchase of $5 billion preferred stocks with a juicy 10% dividend is said to be a great investment. It's said that only Warren Buffett can have the power to secure such a good deal.

But here, in KLSE, I had found a similar opportunity which can generate a 9% compound return in the next few years. And the best part is, the risk of this investment is very low.

What we had to do is just buying the Redeemable Convertible Preference Shares (RCPS) of Malaysia Airlines System at its current market prices. This RCPS is a product of MAS' debt-restructuring processes during year 2007.

Here's a short summary about this RCPS:

  • Issued at RM1.00.
  • preferred dividend: 3.0 sen per RCPS.
  • convertible to common share of MAS at RM4.05 by surrendering the RCPS. (period of conversion: four years starting from 1-Nov-2008)
  • at maturity date (31-Oct-2012), all un-converted RCPS will be redeemed at RM1.00.

.

The Potential Return

the RCPS is currently trading at around 70 sen. Assume that we bought it now and hold it until maturity, the average compound return will be at least 9% p.a. in the next four years.

If MAS decided to declare any dividend during the coming years, the holder of RCPS is entitled to received a preferred dividend of 3.0 sen per share. Then the return on investment will become higher, (up to 13%, if the preferred dividend is received in each the four years).

Furthermore, the RCPS is convertible to MAS common shares. As a result, while enjoying the above benefits, the holders of RCPS will not miss the opportunity to ride on the share market performance. If, by whatever reasons, the share price of MAS shoot up during the next four years, the price of RCPS should enjoy the same increase as well.

(the converible feature of RCPS may be the main reason why it's trading at such an attractive price now. People simply tie up its price to the share price of MAS. So, when the share price of MAS drop, the price of RCPS simply follow. By right, a preferred stock should be traded at a premium to its common shares).

For anybody who is interested to buy the stocks of MAS (and the share-holders of MAS), I strongly recommend buying RCPS (or replacing their common stocks of MAS with RCPS). Because the RCPS is currently traded without premium to the common share price of MAS. That means we are paying nothing for the above benefits of preferred shares if we buy the RCPS instead of MAS common shares.

.

Risk Analysis

If we are ready to hold the RCPS to maturity, there's only one risk risk that will cause us earning a return less than 9% p.a. -- MAS may be unable to redeem the RCPS at the maturity date. We have to examine the probability of this event.

According to its latest financial report, MAS is currently holding more than RM 5-billion of cash. The total number of RCPS issued was 417.7 million. Thus, MAS will have to pay out RM 417.7 million to redeem the RCPS if all of them are being held to maturity. That means, the cash currently held by MAS is actually more than 10 times higher than the amount needed to redeem the RCPS.

However, the huge amount of cash in MAS may reduce significantly in the coming years if the operating performance of MAS is very bad. But I have little worry about that.

One of the reasons is our government's policy that always protect the GLC's. Thus, despite the economic downturn and the increasing competitive environment, I think that the chance of MAS going into bankruptcy is very low. The second reasons is merely my confidence on the management team leaded by Idris Jala. I believe that with his Business Transformation Plan, Idris will turn MAS into a continuous profitable company.

.

Conclusion:

With a purchase price around 70 sen, the compound return rate on RCPS of MAS will be:
  • minimum 9% in the next four years,
  • between 9% ~ 13%, if MAS declare dividend,
  • even higher return if the share price of MAS go up.
While there's a risk that MAS may not be able to redeem the RCPS at maturity, I believe that the probability is very low.

.

03 November 2008

Profit of AirAsia (Part 2)

The main purpose of this article is to discuss why we should examine the economic performance of AirAsia from the perspective of the whole AirAsia Group, i.e. we should consolidate the statements of AirAsia with 100% revenues and profit/losses from TAA & IAA.

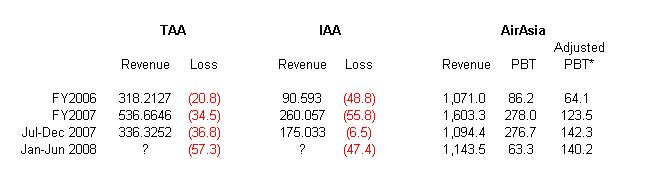
First, let’s have a look at the revenues and profit/losses of the three entities in AirAsia Group, presented separately in the following table (all figures are RM illion):

adjusted profit 3B

  • (the Jan-Jun 2008 revenues for IAA & TAA are not announced yet.)
  • * Adjusted PBT of AirAsia shown excludes non-operating items, but not including the profit/losses from IAA & TAA.

.

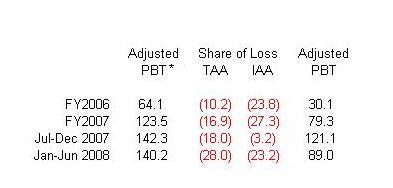
If we include the share of losses (48.9%) from TAA & IAA into AirAsia’s income, then AirAsia’s profit will be as shown in the following table (as discussed in my previous post):

adjusted profit 2

After these adjustments, the earnings of AirAsia will be about 8.9 sen per share (twelve months ended Jun-2008). If we accept this figure, then the current PE ratio of AirAsia is just around 12x, which is a very attractive level for me due to the high potential of AirAsia's earning growth in the coming years.

However, I still think the above adjusted figure is not reflecting the real economic performance of AirAsia. In my opinion, these figures may have been distorted by two factors – the asset allocation in AirAsia Group, and the transactions between the entities in the Group.

Let’s discuss them one by one.

.

1. the asset (aircraft) allocation of AirAsia.

As we know, currently there are two types of aircrafts in AirAsia Group – the old Boeing-737, and the brand new Airbus-320. And we know that the later is the more profitable one due to its oil-efficiency and low maintenance cost. So, the routes served by Airbuses are more profitable than those by Boeing, especially in recent periods of high oil price.

What happening in AirAsia Group is, the allocation of Aircrafts is not even among the entities in the Group. AirAsia Malaysia is operating almost all the Airbuses, while the old Boeings are being pushed to TAA and IAA.

For example, according to the figures announced for the quarter ended Jun-2008, out of the 39 airbuses in the Group:

  • 35 of them are allocated to AirAsia Malaysia,
  • only five are in TAA,
  • and none in IAA.

few weeks ago, AirAsia announced that all its routes in Malaysia are now operated by new Airbuses.

In other words, AirAsia pushed the non-profitable assets to its associates, and retained the most profitable assets within Malaysia. This might be one of the reasons why TAA and IAA are suffering continuous losses while AirAsia is making great profit.

So, if we adjust AirAsia’s income statement using only 48.9% share of losses from TAA and IAA, we are giving more weight on the Airbuses, and have a lower weights on the poor-performing Boeings. As a result, we will get an upward-biased figure about the Group’s performance.

Some people may argue that AirAsia Group is replacing all the Boeings with Airbuses. Thus TAA and IAA might become as profitable as AirAsia (Malaysia) after the replacement. So, the upward biased figures of AirAsia’s statements is a more accurate measure of Group’s future performance (After all, the future performance should be most concern to the shareholders, right?)

I will not agree to this argument. Though AirAsia is accelerating the retirement plan of the Boeings, it will take several years to complete the plan. By then, the new Airbuses today may become aged, and their maintenance will become higher, and who knows, they may just become like the old Boeings today. So, to be consecutives, I think we’d better use today combination of assets (a mix of new and old) even when we are estimating the Group’s future performance.

.

2. The transaction between TAA, IAA and AirAsia. (the Aircraft Rentals)

As we know, all the aircrafts of the Group are owned by AirAsia. So, to operate those aircrafts, TAA and IAA have to pay rental fees to AirAsia. This is another part that may distort the reported performance of AirAsia.

When AirAsia receive rentals from TAA & IAA, it’s recorded as an income, which is off course 100% reflect on AirAsia’s earnings. So, the higher the rental, the more it benefits AirAsia. But from the view of TAA or IAA, these rentals are expenses. That means a higher rental fees will reduce their profit (or increase their losses), i.e. a higher fee will have a negative impact on them and thus AirAsia.

Again, because AirAsia owns 48.9% stake in TAA and IAA, only half of the rental expenses in TAA and IAA would be consolidated into AirAsia’s statement, while 100% of AirAsia’s rental income will be reflected on the same statement. So, by simply charging a higher rental fee, AirAsia could increase its reported earnings without improving its operating performance.

From the perspective of the whole AirAsia Group, the rental fee among entities shouldn’t have any effect on the overall performance. So, we should consolidate 100% of the revenues and profit/losses of TAA & IAA into AirAsia’s statement, to get a clear picture on the Group’s operating performance.

.

Conclusion:

By treating three entities as a group, we can eliminate the potential distortion of AirAsia’s economic performance from both its asset allocation policy and the aircraft rental fees.

The following table shows the 100% consolidated revenue and profit/losses for AirAsia Group. Profit margins of AirAsia (Malaysia only) are included in the table for comparison purpose. (Revenues and PBT are in RM million, Margins are in %).

adjusted profit 4B

  • The 3rd column (AirAsia Margin) is calculated using PBT reported in AirAsia’s statement.
  • The 4th column, Adjusted AirAsia Margin, are reported figures excluding non-operating items (the foreign exchange gain and selling of interest rate swap contracts), and not including profit/losses from TAA and IAA.
  • the Group’s PBT and Margin are also excluding non-operating items.

From the table, we can see that the overall profitability of AirAsia Group is much lower than the figures reported in AirAsia’s statement (which only reflect the non-consolidated profit of AirAsia in Malaysia).

.

29 October 2008

Profit of AirAsia (part 1)

This article is some discussion about AirAsia's reported profit. By pointing out some accounting pitfall in its statements, I hope that this article can present a more accurate picture about the profitability of AirAsia.

Before we start, let's have a glance on the profit reported by AirAsia in recent years:

  • FY 2006 (ended June-2006): RM 86.2 million
  • FY 2007 (ended June-2007): RM 278.0 million
  • 6-month ended December-2007: RM 276.7 million
  • 6-month ended June-2008: RM 63.3 million

* (Last year, AirAsia changed its financial year end from June to December.)

All the figure above are PBT (profit before tax). I think PBT is a more accurate measure of AirAsia's profit because its after-tax-profit figures are highly distorted by the "deferred tax" item. (For more about this, please read: My Mistake - the "Defered Tax" in AirAsia's profit )

Nevertheless, there are two things we had to be cautious about these PBT figures.

.

1. Special Income.

First, we should adjust the profit against non-operating income. A significant item in AirAsia's statements is the "foreign exchange gain". As we know, AirAsia has huge amount of loans that is denominated in USD. As a result of USD depreciation in recent years, AirAsia had recorded some "foreign exchange gain". However, most of these "profits" are just accounting gain, which won't generate any real cash flow or economic value.

This is because AirAsia had entered into some foreign exchange forward contracts, which help it to hedge against the appreciation of USD (these contracts had swap the future repayments of AirAsia's loan from USD into Ringgit). So when USD depreciates and the loan amount of AirAsia is decreased, AirAsia should suffer a comparable amount of loss in the value of its hedging contracts. The problem in AirAsia's income statement is, it only regconized the exchange gain from the decreased amount of loan, and doesn't take into account the loss of its foreign exchange contracts (they are "off-balance sheet item" and not reflected on income statement).

Due to some reasons, (e.g. AirAsia is not doing 100% hedge on its loan amount, the fair values of forward contracts also affected by market activities, etc.), the actual gain/loss from foreign exchange rates are more complicated. However, it's quite sure that the real total gain/loss is much smaller than the figures reported in AirAsia's income statement. So, to be conservative, we'd better exclude all the foreign exchange gain/loss to get a clearer picture on AirAsia's profitability.

Besides the foreign exchange gain, AirAsia had also recorded a gain from selling some interest-rate swap contracts during FY2007.

The adjusted profit of AirAsia, excluding those special items, are summarized as follow : (all numbers are RM million)

adjusted profit

.

2. The Losses in Thai AirAsia (TAA) and Indonesia AirAsia (IAA).

Until today, TAA and IAA still suffering loss.

AirAsia owns 48.9% stake in TAA and IAA. Thus the same portion of losses from these two entities should be reflected on the income statement of AirAsia. However, AirAsia had stop recognizing these losses from both TAA and IAA.

Again, it's because of the accounting method used.

AirAsia's investments in TAA and IAA are accounted for in its consolidated financial statements using equity method of accounting. The following paragraph is extracted from AirAsia's annual reports:

  • The Group discontinued recognition of its share of further losses made by Thai AirAsia as the Groups interest in the jointly controlled entity has been reduced to zero and the Group has not incurred any obligations or guaranteed any obligations in respect of the jointly controlled entity.

Though some people may argue that the equity accounting is a suitable one, I think that the profit/loss of TAA and IAA should be included in AirAsia's statement to fully reflect its profitability.

The reason is simple. First, TAA, IAA and AirAsia are operating as a group (e.g. they share the same ticket booking system), thus they should be considered as parts of a whole body. Second, AirAsia is leasing its aircrafts to TAA and IAA, so they have to pay rental fee and maintenance charge to AirAsia. If their operation continue to face difficulties, it's possible that they will postpone the payments or, worse, fail to meet their payment obligation. Thus, the fact that TAA & IAA are "limited company" doesn't stop AirAsia from bearing the risk of their further losses.

The following tables list the related parties transactions between AirAsia and TAA & IAA, a simple illustration about their relationship.

1. AirAsia's income (RM million) from TAA and IAA:

adjusted profit 5

2. Amount of money that TAA & IAA owe AirAsia (RM million):

adjusted profit 6

.

Conclusion:

To have a fair evaluation on AirAsia's profitability, the non-operating gain/loss should be excluded, and the profi/loss from TAA & IAA should be included. Thus, the real profit of AirAsia in the past few years should be as follow:

adjusted profit 2

(* the first column is the adjusted profit excluding non-operating item).

As we can see, these figures are much smaller than the PBT reported in AirAsia's income statment.

.

...... continue reading : Profit of AirAsia (part 2)

.

15 June 2008

Why I'd never worried about AirAsia's debt.

One of the reasons that investors don't like AirAsia is the huge amount of CAPEX and borrowings.

In this article, I'll discuss how good is AirAsia in managing its debts.

1. Interest rate hedge

Interest rate hike is a essential risk for highly debted company. AirAsia hedges against the risk by entering into interest rate swap contract that will convert almost all of its debt into fixed rate debt.

According to its Dec-2007 report, AirAsia’s swap contract obliges it to pay fixed interest rate of between 4.78% and 4.90% instead of being subjected to the floating US-LIBOR for the entire loan amount over the entire tenor.

The hedging of interest rate will stabilize AirAsia' future cash flow, and help it to maintain the current low interest rate throughout the whole repayment period.

2. Forward foreign exchange hedge

As the borrowings of AirAsia are all in USD, it will benefit from the depreciation of USD. Moreover, Airasia had entered into forward exchange contracts for settlement at fixed Ringgit rates when the USD had depreciated.

For example, as disclosed in Dec-2007 report, AirAsia had swap its RM3.3 billion equivalent debt into ringgit at exchange rates between RM 3.000 ~ RM 3.369. Because the exchange rate of USD to Ringgit is much higher when it borrowed the money, AirAsia is actually making a profit from the repayments of principal loan amount.

These profits from foreign exchange had been recorded in AirAsia’s income statement. In the latest quarterly reports, we can see that the financial cost of AirAsia is a positive value (which means it’s an income, not expenses). This is because the foreign exchange gain from the repayment of debt is higher than the interest expenses.

The following table shows AirAsia’s interest expenses & foreign exchange gain during pass two years.

foreign exchange gain

And the most important part is, these exchange profit are recurring! (because AirAsia had swapped its debt into ringgit at a favorable rate.) With this recurring income, I never doubt the ability of AirAsia to pay the interest of its loan.

3. Tax Incentive

AirAsia has been granted a great amount of tax incentive from our government, for its CAPEX in purchasing aircrafts.

How much is the tax incentive? Let’s look at the recent figures.

Tax incentive

From my own estimation, for every dollar AirAsia spent in purchasing aircrafts, the tax incentive incurred is enough for it to pay the loan interest for at least 3 years! As the repayment period of AirAsia’s loans are only 12 years, the tax-incentives had actually helped to cover a substantial part of its financial cost.

So, why not borrowing?

Let’s look at this tax incentive from another angle of view. The following table shows the PBT of AirAsia and the tax it should have paid if there’s no incentive:

Tax

And the actual taxes paid by AirAsia during this period are:

  • FY2006:RM 2.2 million.
  • FY2007:RM 5.1 million
  • July-Dec 2007:RM 1.5 million

Can you see how much tax savings had AirAsia been enjoying? This a main reason why I've never worried about the high CAPEX of AirAsia.

In fact, the fast expansion of AirAsia, leveraging on financing facilities, is one of the factors that enable AirAsia to maintain its profitability. Because in the highly competitive LCC industry, only the lowest cost player (through effective cost reduction, economic scale, and fast penetration into the market) will survive and prosper.

Since it's able to manage its debts so well, I think AirAsia's way of expansion (through borrowings instead of issuing new shares) is the best way to benefit the shareholders without diluting our interest in the company.

.

[updated 29-10-2008]: There's a serious mistake in this article -- the foreign exchange gain reported in AirAsia's income statement is not a real gain. Though I don't know the exact figure, I'm quite confident that AirAsia's actual (recurring) exchange gain/losses should be much smaller than the figures stated in this article. For more detail, pls read my post: Profit of AirAsia (part 1).

.

16 May 2008

Sbagan - a candidate for value-investing.

NOTE:

This company was recommended by a member from the forum chinese.cari.com. Then I did some research on it, and surprisingly found that Sungei Bagan is not a plantation company. This article is actually a summary of what I’ve published on that forum. (Those who understand chinese, welcome to pay a visit there.)

Today, I decided to join a forum named The Value Circle. It’s not an open forum, which means only selected members are eligible to view the posts. To join this forum, an analysis article of at least 500 words had to be submitted for approval. As a lazy-man, I just rearranged my opinion about Sungei Bagan into the required format, and translated into English, before doing my submission. I hope that they will approve my application.

I just made a copy of my submitted article here(with little changes). It’s a bit long, enjoy your reading!!!

.

Elevator Pitch:

Most of the people may think Sungei Bagan is a plantation company.

Well, while it’s still running its palm oil business, its investment holding activities has now become the most important parts of this company.

If we have a look at its earning, we’ll find that the operating income from its plantation business is actually quite small, even less than the interest gain from its cash holding. The growth of the company’s equity is now more rely on the dividend income and capital gain from its investment. This capital gain from its investing activities is not stated in the company’s income statement.

From the asset view, the fixed properties only contribute less than 10% of its total assets. More than 50% of its asset is the investment in quote shares, and about 40% is cash.

So, when evaluate this company, we should pay attention to its assets and equity growth.

.

Value Proposition:

In the financial reports on and before FY-2006, the values of Sungei Bagan’s assets are hidden from its balance sheet. This is because most of its investment holding are recorded at cost instead of market value. Starting in FY2007 annual report, the company changed its accounting standard, from then the values of its investment had been reflected on its balance sheet. However, few people noticed about that.

Here’s my summary about Sungei Bagan’s equity.

Fixed Assets.

Sungei Bagan only has two properties.

One of them is the oil-palm estates. According to its report, now Sungei Bagan own 2,744 acres of estate, which is recorded at a book value RM1.36 million. This is surely under-valued, because the last revaluation of this estate was done on 1959. Today, oil-palm estate is worth at least RM 10 thousand per acres, which means the values of Sungei Bagan estate should be more than RM 27 million.

Another asset is a 999-year lease-hold apartment located in London. Sungei Bagan bought this asset in 1997 at a price of RM 7.4 million. Today, it’s recorded at a book value of RM24.5 million. This growth is probably a result of properties bubble. So, for conservative valuation, I think we better revise the value of this apartment back to its buying cost, i.e. RM 7 million.

So, the revised value of Sungei Bagan’s fixed asset should be around RM 35 million. This value show that the fixed assets only made up of about 10% of the company’s equity. ( about 50 sen per share.)

Investment in Quoted Shares

Sungei Bagan has investment in both local and overseas stocks.

In Malaysia, it only invest into two stocks, namely Kuchai and Kluang. Today, Sungei Bagan is 9.38% shareholder of Kuchai, and a 5.98% shareholder of Kluang. The amount of shares held has not been changed for many years. In the FY2007 reports, the market values of these shares is about RM23.3 million.

For the shares outside Malaysia, I’ve no idea about the composition. According to the company’s report, these shares had a market value of RM 91.5 million at Jun-2007.

Sum up the local and overseas holding, the company investment in shares is valued RM 114.7 million.

Investment in Associates

This investment consists of two parts—unquoted shares, and quoted shares.

The book value of unquoted shares is only about RM 6.3 million. So, I think we can ignore this in our analysis.

The quoted shares worth about RM 74.0 million at Jun-2007. This is actually the NAV of its shares in Raffles-Asia Investment Company (RAIC). Sungei Bagan holds about 32% of RAIC, which is actually a closed-end-fund. RAIC is managed by a Singapore’s fund manager, namely Charted Asset Management Pte Ltd. ( website: http://www.cam.com.sg/ )

According to its latest report, RAIC’s portfolio consists of stocks from Singapore, Hongkong, Indonesia, Korea and Malaysia. RAIC declared dividend to its share-holders every year, and most of the time Sungei Bagan would reinvest the dividends into the fund.

Historical Growth of Sungei Bagan’s portfolio.

Sungei Bagan is holding a huge amount of Cash — RM 125 million, equivalent to RM 2.07 per share.

In the following table, I’ve include the amount of cash and the market values of the quoted shares held by Sungei Bagan in the past few years.

(value stated in RM million)

sbagan equity table

.

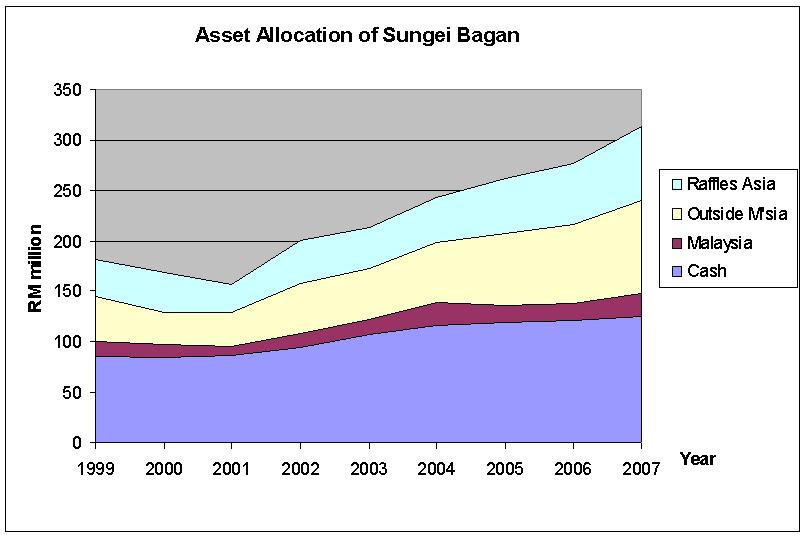
The following graph shows the growth of Sungei Bagan's portfolio:

sbagan equity

From the table, the value of Sungei Bagan’s portfolio has shown a CAGR of about 7% in these years. The value of this portfolio at Jun-2007 is equivalent to about RM5.20 per share. Now the market price of Sungei Bagan is about RM2.80 per share, which is quite low as compared to its assets.

.

Valuation:

According to the Q2-FY2008 report, the combination of Sbagan’s portfolio at Dec-2007 was as follow: CASH RM 132 million, Quoted Shares RM 107 million, NAV of Raffles Asia (approximate) RM 70 million.

Total value of this portfolio is about RM 309 million.

Due to the current economics climate, many are expecting that the stock market will continue to fall. So, to be conservative, let’s make a 50% discount on the value of quoted shares held by Sungei Bagan. This will reduce its portfolio value from RM 309 million to about RM 220 million, which is equivalent to about RM 3.60 per share.

So, Sungei Bagan’s current share price of RM 2.80 is surely lower than its value.

.

Risk

Because a big part (about 60%) of Sungei Bagan’s portfolio is investment in stock market, its equity will shrink when the stock market is going down. This is the risk that we had to consider.

However, with its current combination of equity, even if the stock market plump 80% from JUN-2007’s level, Sbagan’s portfolio would still worth RM 2.70 per share. If we add in the value of its fixed assets, Sungei Bagan share should worth at least RM 3.0 in this worst scenario.

.

Driver:

If we accept my valuation of RM3.60 per share as the intrinsic value of Sungei Bagan, then the current share price of RM2.80 will give us a safety margin of about 20%. This may not be enough for some conservative investor.

What we can do now is just keep it in the watch list. In my opinion, some event in the near future, e.g. the burst of palm oil price bubble (I believe that it’s just around the corner) would probably give us a best opportunity to buy in Sungei Bagan with a very satisfactory margin of safety.

.

Clonclusion:

Intrinsic value: RM3.60

Classification: Asset Play.

.

13 January 2008

Reasons investing in RUBHD

I discovered Ranhill Utilities Berhad few months ago.

It was an incident. A friend gave me a “tips” that a stock named Ranhill would go up very soon, and ask me to buy the stock. So, I went through its annual reports, then found that it was a conglomerate involves in various sectors ranger from construction to power generation plant. But after a short analysis, I immediately found that majority of its income is actually generated from one subsidiary—Ranhill Utilities Bhd, a company which is also listed on KLSE.

Then, my interest was switched to this RUBHD. After some research on the nature of its business, I then found that it is a good candidate for value investing, and also for long term investment.

My conclusion is just based on the reasons stated below:

1. Monopoly Business

RUBHD main income is from its subsidiary named SAJH, which hold a Concession Agreement with Johor’s State Government to supply water to the consumers in the state. The concession period is 30 years (from 2001 to 2029). Obviously, this is a stable, monopoly business. Thus, RUBHD doesn’t have any risk from competition or lost of market share.

2. Guaranteed Return

The following passage is taken out from RUBHD’s Financial Report FY-2007, page 97.

"According to the CA, the supply of treated water is charged in accordance to the Scheduled Tariff (water supply tariff to be charged by SAJH for a particular purpose or class of consumers), provided that the SAJH’s Internal Rate of Return (“IRR”) is within the Agreed IRR Band of 14% to 18% over the Concession Period. The Scheduled Tariff is to be submitted to the State Government for approval. The Agreed Tariff (approved Scheduled Tariff) will be gazetted and shall take effect for the applicable operating period on the relevant Tariff Adjustment Dates. The Tariff Adjustment Dates agreed with the State Government are as follow:

(i) First Tariff Adjustment Date – effected on 1 January 2001;

(ii) Second Tariff Adjustment Date – effected on 1 July 2003;

(iii) Third Tariff Adjustment Date – effected on 1 January 2007; and

(iv) Subsequent Tariff Adjustment Dates – scheduled on 1 January 2009 and thereafter at 36 monthly intervals till 2029.

In the event the gazetted tariff is lower than that of the Agreed Tariff, or in any other event the Agreed Tariff was not adopted, the State Government shall compensate SAJH in accordance with a formula as specifi ed in the CA. "

Isn’t this show that the RUBHD has a stream of income which is guaranteed by the State Government?

3. Attractive share price.

RUBHD’s earning per share for FY-2007 is about 70sen. This means that its share is currently trading at a PE value of 4, which is quite attractive.

Besides that, RUBHD’s current share price (RM2.80) is lower than its equity per share. According to its latest report, RUBHD equity per share is about RM3.50, and there is a large amount of cash in the company—its cash per share is about RM2.10. So, I think buying RUBHD at its current share price has a very low risk.

.

Based on the stated reasons, I’d decided to invested some money in RUBHD. At the same time I continued my research on its industry. Then I found that there’s a restructuring scheme coming up soon, which will change the business environment of the water service industry in our country. It is the new Water Service Industry Act (WSIA), which would be in forced at the last quarter of 2007.

This has added some uncertainty to the prospect of SAJH. So, I decided to stop buying RUBHD until I can figure out the effect of this Act on the company. After some studies in these few months, now I’ve gain some understanding about WSIA. I’ll discuss it in my next post.

.

28 December 2007

Titan's prospect for 2008~2010.

In this article, I'll list down the reasons why I think that Titan's prospect in the next two years is quite positive.

Base on the nature of its business, Titan's profit growth can only come from two ways. First, the increase of production capacity. Second, a higher polymer-naphtha spread.

About the capacity.
last year, Titan's newly acquired subsidiary -- PT Titan, only produced about 100 KT of polymer during the whole year, while its capacity is 450 KTA. This year (2007), the production of this subsidiary is expected to be around 200KT, still below 50% of its whole capacity. I believe that, under the management of Titan, this subsidiary will able to utilise 100% of its capacity by the end of 2009. This represent a 20% increase in total production of Titan Group from today.

In December 2007, Titan will start two new plants - a propylene plant (115KTA) and a butadiene plant (100 KTA). The product from the butadiene plant will be directly sold to customers. The propylene produced by the new 115KTA plant will most probably being used as raw material to Titan's PP plant. So, I'm expecting Titan to take some "debottlenecking" process to increase its PP plant capacity by another 100KTA, maybe within two years.

As a conclusion, I think Titan Group's production output will increase by about 40% by the end of 2009.

About the Polymer-naphtha spread
The spread is affected by the supply-and-demand condition of polymer. As we have seen, the polymer-naphtha spread showed a gentle uptrend in the past few years. This show that the growth of demand for plastics is slightly faster than the growth of supply.

Seeing that global economy will continue growing for the next few years (leading by the strongth growth in China), the growth of demand for plastics is there. In fact, a lots of petochemical companies now are having their expansion plan, and new production plants is being constructed in a lots of country/area, just to grab this growing market of polymers.

However, according to the information available now, most of these new production plants are still in the early stage of construction. They are scheduled to start production only around 2010~2011. In this two years (before all these companies complete their expansion plan), Titan has a chance to enjoy a higher polymer-naphtha-spread, due to the strong demand growth and the slow growth of supply.

10 December 2007

My Mistake - the "Defered Tax" in AirAsia's profit

In AirAsia's financial statement, There's a very important item, named "deferred tax". I didn't have any idea about what is it and what it means. (because I was a science-stream student, and never learn about accounting in school). I thought that it's some kind of complex taxing calculation, and I'd just ignored it in my previous analysis of AirAsia.

But, later I found that this "deferred tax" play an important role in AirAsia's financial statement. It made up about 20% of AirAsia's equity, and more than 40% of AirAsia's PAT! So, I think it's a MUST to understand what is it, and where it comes from.

After some readings and studies, I've get some idea about this "deferred tax". I understand that, due to the International Accounting Standard, this "deferred tax" is allowed to be recorded in an income statement. But I really doubt that this is a proper practice in reflecting the financial performance of a company.

The "deferred tax" item in AirAsia, for example, represent the tax credit given to the company. Though this tax credit is incurred during current year due to the company's CAPEX, it can only be realised/utilised in the future, i.e. when AirAsia is asked to pay a tax in the future, it can utilise the the tax credit, and save a lots of cash from the taxes it should pay.

My conclusion is, a "deferred tax" recorded in the income statement of a particular year actually bring no cash-flow into the company during that year. That's not an earning (at least in my opinion), just a future savings of tax. Showing the "deferred tax" in the income statement means recording a tomorrow cash-flow in today's statement. It's some kind of accounting technique to "polish" the financial performance of a company".

So, I've to do a new valuation on AirAsia. According to it's Q4-FY2007 statement, its EPS is about 21 sen, quite a good income. But if we exclude the deferred tax item from its income statement, its EPS is only 12 sen. If we exclude also the special item ("other operational income"), AirAsia's EPS for FY-2007 will become 8 sen only. This will give a PER value of about 25, quite a high number for a conservative investor like me. So, the share price of RM1.90 now is not as attractive as what i thought before.

However, the latest financial report shows that AirAsia still pose a very good prospect in the coming years. It's quite likely to have a 50% growth in PAT this year. So now... I'll hold its stock and continue to monitor its performance. If its EPS for FY-2008 (excluding deferred tax) can grow to a value not less than 15 sen, I'll consider to keep accumulating AirAsia's stock.

16 November 2007

Does Titan's profit depends on oil price?

Some analysts worried about the profitability of Titan due to the rising oil price. On the other hand, the Titan's management always claimed that the company's profit doesn't affected by oil price, but the supply-demand condition of plastics which will determine the polymer-naphtha margin (the price spread between its product and feedstock).

To check whether the management's statement is true, I've done some research on the historical naphtha price, polymer price, and crude oil price. The following chart show the relationship between polyethylene-naphtha margin and oil price from Jan-2004 to Nov-2007:

PE-Naphtha Spread

source: http://www.plastemart.com/

* The prices shown above are international prices in our region. The exact prices of Titan's may not be the same as the above, but shouldn't be much different (within 5%).

From the graph, we can see that the oil price has been rising from about USD$30 to about USD$90 per barrel during this period. Naphtha price moved exactly in the same trend. Polyethylene's price also changed in similar way, but sometimes experienced a time-lag of 1~3 months. When this happened, the PE-naphtha spread will temporarily move in the opposite direction to the oil price, then will back to the normal level when the PE price catch-up with naphtha.

(Example: during Sep~Nov-2006, the oil price dropped from $80 to $60, the PE-naphtha margin temporarily up from $650 to $850 per tonnes. During Jan~May-2007, the PE-naphtha spread drop from $800 to $600 while the oil price rise from $65 to $85.)

As a whole, although there's some short-term volatility, the average PE-naphtha spread remain quite stable during 2004 to 2007, while the oil price has risen for almost 200%. In fact, it showed a slightly upwards trend during this period.

So, it's quite clear that the profitability of Titan doesn't affected by the rising oil price. Instead, Titan's profit is highly depend on the Polymer-naphtha margin, which in-turn depend on the demand-supply condition of plastic market. Seeing that the world's polymer capacity is growing with a slower rate than the demand for plastics, the outlook for polymer-naphtha margin will be quite positive in the near future.

.

[updated 29/10/2008]: Those who interested to view the more updated version of the polymer-naphtha-spread chart , please visit here. In the document, I had also included a worksheet showing the correlation between oil price and Titan's quaterly report. I'll update the document from time to time.

.

09 November 2007

Reasons investing in Titan


I start accumulating the share of Titan Chemical since early 2007. The average cost per share is about RM1.60. In this article, I will list down the reasons I decided to invest in this company.


1. Simple (Single) Business

The main business of Titan Chemical is production of polyethylene (PE) and polypropylene (PP). These products are what we generally call 'plastics'. Basically, it takes the raw materials e.g. naphtha and natural gas, breaks them into small unit of monomer, then combine those monomer become polymer substance.

During its expansion, Titan Chemical always stick to its core business. Last year, Titan acquired an Indonesian company named PT. Petrokimia Nusantara Interindo, which is then renamed to PT. TITAN Petrokimia Nusantara. PT. Petrokimia was the largest PE producer in Indonesia.

2. Leader in polyolefins industry

When Titan start its operation around 1990, its was the pioneer in petrochemical industry of Malaysia. Then it became the largest polyolefins manufacturer in our country. In recent years, Titan has gain about 50% share of our domestic PE and PP market.

Its newly acquired subsidiary, PT TITAN now holds about 20% of the domestic PE market share in Indonesia. After the acquisition of this subsidiary in 2006, Titan has now become the largest polyolefins producer in South East Asia (in terms of production capacity). With its economical scale, Titan can keep a low cost without compromise to quality.

3. Good Management Team

The founder of Titan, Datuk T.T. Chao, a Taiwanese, is a pioneer in the global petrochemical industry. He has built several successful business across continents of Asia and America in his 50-years entrepreneur-life. Let's have a look at his 'resume':

  • In the mid-1950s, Chao was a co-founder of Taiwan's first polyvinyl chloride (PVC) business.
  • In 1960's, he established China General Plastics Group, which included a number of the premier publicly-held petrochemical and plastics manufacturers in Asia.
  • in 1980's, he entered the North American petrochemical industry with the acquisition of a polyethylene plant in Sulphur, Louisiana, and the creation of Westlake Polymers Corporation. (now listed on New York Stock Exchange)
  • in late 1980s, he founded the Titan Group in Malaysia by building the country's first and largest integrated petrochemical complex in the state of Johor.
  • in 1990's, he founded a joint-venture company consisting of a PVC resin plant and downstream calendering plant near Suzhou - Suzhou Huasu Plastics CO., Ltd.(SHPC)

Due to his outstanding contributions to the petrochemical community, he received the Petrochemical Heritage Award from the Chemical Heritage Foundation in 2005.
(press released: http://www.chemheritage.org/press/pr2005/pr_05_jan_17.htm)

Today, Titan Group is led by Mr. James Y. Chao (son of TT Chao). He has more than 30 years experience in petrochemical industry, and has assisted Datuk TT Chao in the founding of Westlake Goup, Titan Group and SHPC. Besides acting as the executive chairman in Titan, he is also the chairman of Westlake Group and Suzhou Huasu Plastics Corp.

Titan's former managing director, Mr. Donald Marion Condon, was named the American Express-Business Times "Malaysia CEO of the year" in 2005. He's re-designated as a director of Titan last year. Titan's present MD (appointed last year), Mr. Thomas Patrick Grehl also has 25-years experience in chemicals industry.

4. Profitability & Growing Potential

Despite the escalating oil price since 2004, Titan's profit keep growing during the same period. The raw material of polyolefins (naphtha) is a refined product from crude oil. Thus, the price of naphtha normally moves in conjunction with crude oil's price. The selling price of polymers will normally following the same trend, but a few months lagged behind. Hence, though the profit margin may become lower when the oil price is in a uptrend, it will be improved later.

More than half of Titan's production is for exportation. Among its customers, China is the biggest market, accountable for about 20% of its revenue. This is big positive sign for me. Firstly, being the fastest growing economic entity in the world, the demand for plastics in China is increasing in a higher rate than other countries; and Titan already enter into this market. The more important point is, Titan's production cost is lower than the China's local manufacturers. Thus, its selling price is competitive while having a sustainable profitability.

(This sounds impossible, but it's true. Besides its economic scale, one reason that Titan has a lower cost is because it is a pioneer in this industry. Titan's start-up cost is much cheaper because its plants are constructed 20 years ago. The new competitors today facing a much higher construction cost due to the high steel price.)

Currently, Titan's has a butadiene extraction plant and a propylene plant under construction, and is going to be completed soon. These two new plants is scheduled to test-run in Dec-2007, and their capacity is able to raise Titan's revenue by about RM1 billion (20%) next year. On the other hand, Titan's business in Indonesia is improving. I believe that its subsidiary (PT Titan) is going to turnaround soon, and begin to make positive contribution to Titan. And, Indonesia's market will provide a great growing potential for Titan in long term.

So, although the oil price is likely to keep rising, I believe that Titan will keep making bigger profit with the continuous expansions, coupled with its great operation and procurement strategy.

---------------------------------

I think Titan is undervalued at a share price of RM1.60. I decided to buy its share at this price due to the following considerations:

  • The price is lower than its net asset value. (RM1.90 per share)
  • The P.E. is lower than 7.0, based on its earning per share FY-2006 of 24 sen. (excluding the profit in the acquisition of PT Petrokimia)
  • Its profit after tax will grow with a rate of 10 ~ 20% p.a. in the next few years, if the crude oil price is stabilized. (the grow rate will be higher if the oil price fall).

when the oil price fall back to a normal level, Titan's profit and its share price will rise dramatically . (I don't know when it will happen, but i really don't think the high oil price is sustainable). My own estimation, my investment in this counter will be three to five years.


05 November 2007

AKN - My short-term investment.

I start accumulating AKN's share since March-2007. Now it is accountable for about 23% of my portfolio's value. My average buying price is RM0.51.

I noticed this company in early 2006. At that time, its share price is about 40 sen, very low compared to its historical prices in years 2002 ~ 2004 (around RM5) . The share price was so low because it's been suffering loss for two consecutive years. And the share price was lower than half of its net asset value.

So, I keep an eye on it. After one year studying and monitoring it, I decided to buy its share and keep it for about one or two year. (that's considered a short-term investment for me).

Here's my observations on AKN before coming into the buying decision:

AKN was a good company, manage to generate a stable income in many years during the past. Its share price fell deeply in 2005 due to the huge loss it suffered in that year. (about 80 sen per share). This loss was mainly aroused from two factors:

  1. There's a fire incident on Jun-2005, destroying one of its operation premises located at Penang. This had cause damages to the machinery and ceased the factory from operation. Thus, the company had to out-source its operations to external parties, to meet the custormers' delivery orders. This has cause a big lost to the company due to the high cost of out-sourcing. As a result from this, the factory's operation had been temporarily stopped since 2006. also, The company had to compensate the factory's staff and workers who had loss their job.
  2. The design, development & distribution division (DDD division) of the company, which is based in China, was suffering loss due to the tough competition from China's local companies.

The loss from the fire incident is big. But this is obviously an one-time-event, and shouldn't have any continuous impact in future. On the other hand, the loss suffered from the DDD division, though is much smaller, is likely to be a sustainable one. So, we had to see how AKN's management deal with this.

AKN's management had taken some steps to rationalise its operation since 2004. Among those rationalisation processes, I think the following two steps are the most important:

  1. Winding-down the lost-making DDD division. The company's management had decided to dispose the subsidiaries under this division, and exit entirely from the related semiconductor chip & software business.
  2. Acquisition of a new subsidiary, named Paramount Discovery Sdn Bhd - a company that provide polymer coating solutions for the production of powder-free gloves.

Firstly, to discontinue the operations of DDD division is a wise decision. This will free the company from the continuing loss of the subsidiaries under this division, and at the same time the cash generated from the disposition can help the company to reduce its dept. (hence, reduce financing expenses of the company)

Then, the acquisition of Paramount Discovery Sdn Bhd make the company venture into the strong-growing latex glove industry. Unlike the semiconductor sector, (in which most other subsidiaries of AKN are involved), latex-glove industry is almost unaffected by economical cycle. Paramount Discovery will generate a stable growing income for the company in the future years.

After the rationalisation, the company has turn-around successfully in the FY-2007 (ended March). That's the time I start buying AKN's share.

Here's some figures that make me feel safe to buy AKN's share at about 50 sen:

  • the buying price is only half of its net asset per share (about 90 sen).
  • Its loss-making division is to be disposed soon. The earning from Paramount alone, when reflected on its income statement, will be about 10 sen per share. Together with the earnings from other subsidiaries, AKN's P.E. ratio will be less than 5.
  • After the rationalization plan, AKN's main business concentration is now switch from semi-conductor industry to glove industry. (The Paramount's earning now accountable for the highest portion of AKN's income.) Latex-glove industry is a sector that I'm quite familiar with, as compared to the semiconductor business. And, I'm very optimistic about the future growth of latex-glove industry in Malaysia.

So, I'm confident that AKN's performance for the FY-2008 will show a strong improvement from the previous year. (earning per share will be around 12 ~ 15 sen, I think). By then, its share price may rise to about RM1.50. I'll cash out my profit at that time, and put my money back into some long-term-investment counter.

.

[updated 10/7/2008] : I had sold all my AKN in July-2008. For the reason of selling it, please read my post "selling stock".

.

21 September 2007

Supermax and other Latex Glove Companies.

the global demand on latex gloves has been growing exponentially in recent years. Since this growing trend of glove market is not likely to stop for the coming years (though it may slow down gradually) , the latex glove manufacturers will benefit a lots from it.

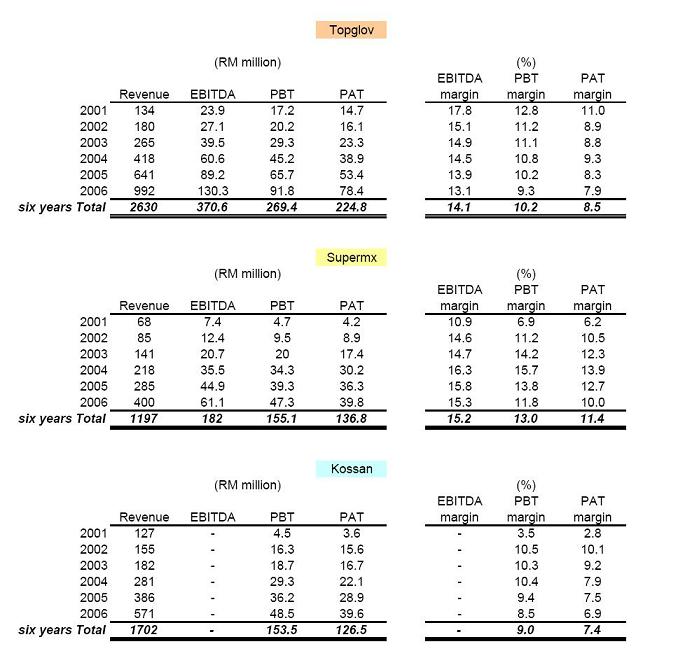
Malaysia's companies are the largest suppliers of latex gloves in the world. There are several latex glove companies listed on Bursa Malaysia. Here's a simple comparison based on their annual report FY2006:

Obviously, the three largest companies are:

  1. Topglove
  2. Kossan
  3. Supermax

The huge production capacity of these companies ensure that they can produce gloves with lower cost than their competitors. Hence they can maintain their profit margin while keep the selling price competitive. When I decided to buy a glove company, I only considered this three biggest companies. After doing some study, I've chosen to invest in Supermax.

The first reason is Supermax has a better earning power. I've create a table to make a comparison between 3 companies:

(I don't have the EBITDA data of Kossan, but the comparisons of EBITDA should be similar to PBT and PAT)

Clearly, Supermax has a highest profit margin among them. This is a result from the continuous effort of its managment in controlling the cost. The 2% difference in profit margin can make a very big difference, especially when the market become gradually saturated and tough competitions occur. So, I think Supermax will become the last winner, though its growth rate in recent years is a little slower than Topglov and Kossan.
At the end of Sep-2007, when the privatisation of Seal Polymer is completed, Supermax is going to beat Kossan and become the 2nd largest glove company. If Supermax privatise APLI in the future, it will become almost same size as Topglove.
Another reason I choose Supermax, is because the price of Topglove and Kossan are already too high. Look at some figures relating the share prices of these companies:

Topglov

Supermax

Kossan

PAT '2006 (RM million)

78.4

39.7

39.5

No. of share (million)

300

227

160

Earning per share (sen)

26.2

17.5

24.7

Share price (RM)

6.2

2.4

4.5

Equity per share(RM)

2.0

1.2

1.3

Price/Earning ratio

24

14

18

Price/Equity ratio

3.1

2.0

3.4

* the no. of share & equity per share are based on the latest quarterly report.

Due to my investment prinples, I'll never buy a company that has a PE higher than 15, no matter how good is the company. So, I'll never consider to buy Topglove though it's the biggest latex glove company, unless its share price fall below RM4.50. Besides, Supermax's Price/Earning ratio and Price/Equity ratio is significantly lower than the other two, This make Supermax a better choice for a secure investment.

19 September 2007

Reasons of buying Supermax

Let's have a quick look on Supermax. With its current share price of about RM2.40,

  • the P.E. ratio based on the profit for FY-2006 is about 13.
  • the net asset per share is about RM1.20, about half of its share price.
  • the liability to equity ratio is about 1.0

As we can see, the figures are not very attractive. Its share price is not at a bargain level, nor is it very expensive. I may consider its current price is quite 'fair' due to its latest financial condition. I invested in Supermax not because of its cheap price. I invest in it because it is a continuous growing company with a bright future.

As Warren Buffette said, "it's much better to own a wonderful company with a fair price, than buying a fair company with wonderful price".

This is what i feel when I invested in companies like AirAsia and Supermax.

Supermax has some criteria that make it a wonderful company that worth to buy:

  1. Simple business model - manufacturing of rubber gloves
  2. Growing market for its products
  3. Good management
  4. Profitability - Consistent profit margin

Let's go through these one by one:

1. Simple Business Model Supermax has only one core business – Manufacturing and selling rubber gloves. It has a wide range of rubber gloves, made of natural latex or synthetic rubber. Its products are mainly for dental and medical use. Most of the products are exported, mainly to U.S. and Europe.

The merge between Supermax and Seal Polymer is going to be completed by the end of Sep-2007. Seal Polymer is involved in the similar business as Supermax. I like a company that grow while concentrate on its core business.

2. growing industry. The demand of rubber gloves has been growing in recent years, due to the growing health conscious and hygiene awareness, especially in the advanced countries like U.S. and Europe's. And the most important point is, the demand on medical gloves will only keep growing, independent of economical cycle. Hence, Supermax has a consistent growing market. From 2002 until now, Supermax’s revenue and profit had recorded an average growing rate of about 40% per year. I’m confident that its growth rate will be maintained above 20% per annum for few more years.

After merging with Seal Polymer, Supermax now has become one of the biggest manufacturers of rubber gloves in the world.

3. Management Team Tthe financial condition of Supermax is better than other glove companies in Malaysia, due to the continuing effort of its management, under the leadership of its CEO, Mr Thai Kim Sim.

Two years ago, Supermax had acquired shares of Seal Polymer and APLI, and became largest shareholder of these companies. Mr Thai had then become new CEO of these companies. At that time, APLI was suffering loss; and Mr Thai had turn APLI into profitable in early 2007. This is an evidence showing his ability of managing a company, especially in reducing operational cost.

about two months ago, most glove manufacturers in Malaysia faced an allegation by Tillotson Corporation (a U.S. company), of patent infringement of nitrile gloves. Supermax then announced that they will pay the loyalty fee to Tillotson Corporation, for all its nitrile gloves selling in U.S. This immediate response shows that Supermax's management is paying respect to intellectual property of other party.

4. Consistent Profitability About 50% of its cost is the raw material – latex. In recent years, the price of bulk latex rose from RM2 per kg (year 2002) to about RM5 per kg now. But the EBITDA margin of Supermax is maintain at about 15%. So I never worried about the rising price of latex, because Supermax is always able to pass the rising cost onto its customers.

Besides its consistency, Supermax's profit margin is also better than average value of other glove companies. So, it will always be profitable while selling its product with a competitive price.

.

.

[updated 10/10/2008]: I sold Supermx at the end of September-2008. Please read this post for the reason.

.

27 August 2007

How big is the brand "AirAsia"?

Some people around me always travel in flight due to their job. Hence, I'd heard a lots from them about AirAsia and MAS. And from their mouth, I know the conditions of the services and performances of these airlines.

Here are my observations on the growth in AirAsia during these years:

One or two years ago, people still don’t like AirAsia. They choose AirAsia just because it is cheap. People has a lots of complains like:

  • Attitude of its staff were bad.
  • The food on flight is not good enough.
  • It doesn’t assign seat numbers for passengers.
  • Boarding onto AirAsia’s flight is a bit mess up, just like getting on a bus.
  • Delays and cancellations are common.
  • Some rumors said that AirAsia sometimes combined the passengers of two flights into one.
  • Actually, most of these negative impressions arise from people’s over-expectation on AirAsia to meet the same standard as other airlines, because most people that took AirAsia didn’t have any experience with other LCC. They can only compare AirAsia to their previous experience with normal airline, especially MAS. We all know that, MAS is famous (worldwide) for its good service and excellent attitude. (always, I heard that MAS flight attendances are all quite beautiful too). In fact, MAS wins the Skytrax's Best Cabin Staff Award for many years. So, the quality of AirAsia’s services is just too bad as compared to MAS.

    while AirAsia is keep improving, people now gradually get used to AirAsia’s no-frill style – no ticket, no assigned seat, no free meal, etc.

    An important improvement of AirAsia is the reduction of delayed flight. AirAsia’s on time performance for the past six months is about 85%. Some of my friends now prefer AirAsia than MAS, even when they are on an official trip (means they don’t have to pay for the air tickets, their employers will pay for them), simply because they are fed up with the (infamous) flight-delays of MAS.

    Another reason they prefer AirAsia is that AirAsia makes their schedules more flexible, because it has a higher flight frequency than MAS. They have more choice for the departure time.

    So now, the name “AirAsia” means a lots.

    1. It means “cheap”. This is the most sucessful brand image for AirAsia. When I fly, I definitely choose AirAsia; because I know that with AirAsia I'm having the lowest fare.
    2. It also means “less delay”, as compared to MAS.
    3. It means “more choice” for departure time, due to its high flight frequency.
    AirAsia today has gradually become an airline that people prefer to fly with, not only due to the economic consideration. That’s what we call “the power of brand”.

    Besides my own observations, there are some supporting points that AirAsia is a great brand:

    1. In the new released World Airline Awards® year 2007, AirAsia ranks no.1 in Asia region for the Best Low-cost Airline Award. (The Skytrax’s World Airline Awards® are recognized around the world, and renowned for being the only truly global, Independent passenger survey of airline standards.)
    2. Recently, a new AirAsia Credit Card was launched. The issuer of this new AirAsia’s card is Citibank. As we know, Citibank is the top-brand in credit card service. Citibank is now partnered with AirAsia...... I think this means something.
    3. Couple of weeks ago, the Virgin’s Group announced that it’ll take up 20% in FAX. There are total five airlines under Virgin Group, each of them carry the word "Virgin" in their name, e.g. Virgin Atlantic, Virgin America, etc. But this time, instead of using its “Virgin” brand, FAX is renamed to "AirAsia X" to start its long-haul LCC business. As Tony said, “AirAsia brand is very big, bigger than Virgin out here.”

    21 August 2007

    Reasons of buying AirAsia

    In value-investment, you must be able to list downs the attractive features of a company that you're investing in. If your text can't cover for (at least) half page of a paper, it's probably that you're not quite understand this company, and this investment can't be considered a secure one.

    So, I decided to list down all the reasons for every company that I buy. I start with AirAsia, because this is my latest investment. I'm still quite excited that I found this company for investment.

    I invest in AirAsia, because it's a great company, due to the following reasons:-

    1. Simple business model that I can understand.
    2. A growing company in a growing industry.
    3. Great management – Tony Fernandes
    4. High profitability – It has a high profit margin compared to the other LCCs.
    5. Leader in the industry – Best Low-cost Airline Award (rank no.1 in Asia region), year 2007 .
    6. Strong Brand Name - high value of intangible asset.
    Above reasons show how good is the AirAsia. I'll elaborate these points one by one in the following comments.

    But, no matter how good is a company, it's not a good investment if the price is high. I have to make sure that I'm not paying too much for it. Here's my own analysis based on its 3Q-2007 report:

    • AirAsia's stock price is around RM1.80 today. 9-month profit for FYE2007 is about RM0.13 per share. this means its PER for 2007 is about 10 to 12.
    • its 9-month revenue grow 53%, and the 9-month profit before tax grow 190% as compare to 2006.
    • based on its growth in fleet size from 50 aircrafts (this year) to about 150 (year 2013), my estimation for its average growing rate in the next five years is about 25% per annum.
    • The ratio of PE to its growth rate is less than 0.5, so the price may be considered cheap. (This is an analysis technic suggested by Peter Lynch).
    • its net asset per share is just 64sen. This is less comfortable for a secure investment. But AirAsia has a great value of intangible asset - its brand name.

    As a conclusion, I'll continue to accumulate AirAsia stock as long as its price is still below RM2.00.

    And I hope that my holding period for this stock is...... forever.

    .

    [updated 3/11/2008]: Months after holding AirAsia, I had found several accounting pitfalls in the statements of AirAsia. In short, AirAsia's performance is not as good as I thought before (i.e. when I wrote this post). For more details, pls refer to my other posts tagged "airasia".

    .

    Related Posts Plugin for WordPress, Blogger...


    SPONSORS: