Showing posts with label resources. Show all posts

16 November 2007

Does Titan's profit depends on oil price?

Some analysts worried about the profitability of Titan due to the rising oil price. On the other hand, the Titan's management always claimed that the company's profit doesn't affected by oil price, but the supply-demand condition of plastics which will determine the polymer-naphtha margin (the price spread between its product and feedstock).

To check whether the management's statement is true, I've done some research on the historical naphtha price, polymer price, and crude oil price. The following chart show the relationship between polyethylene-naphtha margin and oil price from Jan-2004 to Nov-2007:

PE-Naphtha Spread

source: http://www.plastemart.com/

* The prices shown above are international prices in our region. The exact prices of Titan's may not be the same as the above, but shouldn't be much different (within 5%).

From the graph, we can see that the oil price has been rising from about USD$30 to about USD$90 per barrel during this period. Naphtha price moved exactly in the same trend. Polyethylene's price also changed in similar way, but sometimes experienced a time-lag of 1~3 months. When this happened, the PE-naphtha spread will temporarily move in the opposite direction to the oil price, then will back to the normal level when the PE price catch-up with naphtha.

(Example: during Sep~Nov-2006, the oil price dropped from $80 to $60, the PE-naphtha margin temporarily up from $650 to $850 per tonnes. During Jan~May-2007, the PE-naphtha spread drop from $800 to $600 while the oil price rise from $65 to $85.)

As a whole, although there's some short-term volatility, the average PE-naphtha spread remain quite stable during 2004 to 2007, while the oil price has risen for almost 200%. In fact, it showed a slightly upwards trend during this period.

So, it's quite clear that the profitability of Titan doesn't affected by the rising oil price. Instead, Titan's profit is highly depend on the Polymer-naphtha margin, which in-turn depend on the demand-supply condition of plastic market. Seeing that the world's polymer capacity is growing with a slower rate than the demand for plastics, the outlook for polymer-naphtha margin will be quite positive in the near future.

.

[updated 29/10/2008]: Those who interested to view the more updated version of the polymer-naphtha-spread chart , please visit here. In the document, I had also included a worksheet showing the correlation between oil price and Titan's quaterly report. I'll update the document from time to time.

.
23 October 2007

Rising latex price & the glove-manufacturers

In this post, we'll see how the rising latex price affect the profitability of the latex-glove companies. (Latex is the raw material for glove-manufacturing, accountable for about half of the operational costs)

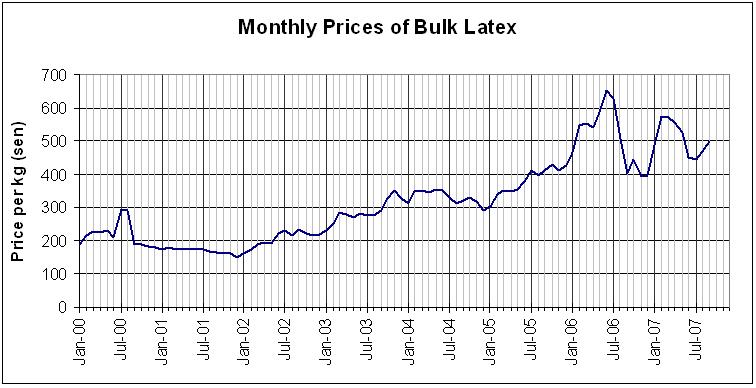
Here's the historical price movement of bulk latex:

Latex Price Jan-00 till Sep-07
source: Malaysian Rubber Board, http://www2.lgm.gov.my/Mre/YearlyAvg.aspx
[updated 30-10-2008: pls click here for the updated-verion of the chart.]

From the chart, we can see the recent price of latex is about 150% higher than that in 2001 & 2002. This definitely will rise the operational cost of latex-glove companies. But will it have a significant impact on their profitability?

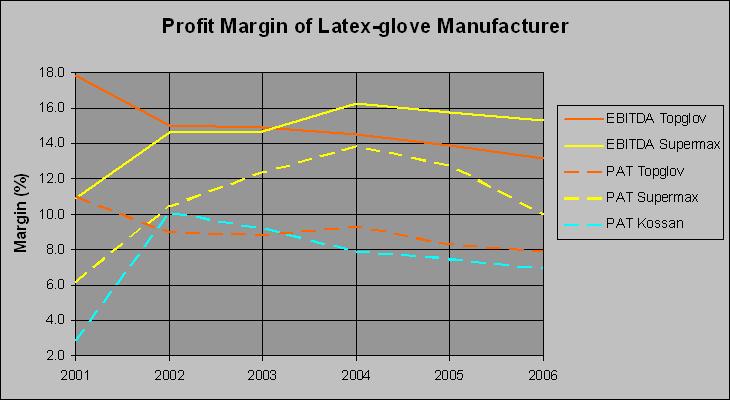
The following graph shows the EBITDA margins and PAT (profit after tax) margins for the three largest glove-companies in Malaysia:

Profit margin (graph)

While the latex price rise significantly from 2002 to 2006, the profit margin of these glove-manufacturers just show a small decline in the same period. This small decline in profit margins could be cause by other factors, e.g. rising financial cost for expansion of production lines.

So, I think we can say the rising price of latex has a minimal impact on the profitabilily of latex glove companies. They are always able to pass on the rising cost to their customers.

Again, I feel that Supermax is the best choice (for investment) among this 3 companies . From the charts, we can see that Supermax's EBITDA margin in 2006 is about 1% higher than that in 2002, while Topglove's EBITDA margin shows a decline of about 2%. This shows that Supermax's management is better in maintaining the company's profitability.

22 October 2007

On Time Performance of AirAsia & other airlines.

one reason I think AirAsia will continue to growth is its great on-time performance. An airlines that has a consistent punctuality will win the customers' respect and build up its name, thus gain a bigger market share in long run.

In this article, I just want to show: how good actually is the the on-time performance of AirAsia?

Here's the figures I get from AirAsia's website:
* a flight is considered on-time if it departs no later than 15 minutes from the schedule time.

AirAsia on-time performance 2007-09

From the chart, its two months (Aug & Sep) average performance is about 88%, Three months average (Jul~Sep) is about 85%.

We have to make a comparison to show how good is this figures. First, Lets compare the on-time performance of Jetstar Airways. (data from jetstar's website: http://www.jetstar.com/).

Jetstar on-time performance 2007-09

We can see that the on-time performance of AirAsia is as good as Jetstar's. And, Jetstar is the winner of the Best Low-cost Airlines (worldwide) in Skytrax's World Airline Awards 2007. I think this shows that AirAsia's performance is among the best in the world. (of cource, in this comparison, we assume that the figures announced on both airlines' website are true and reliable.)

Then, how about the comparisons with others airlines?

After some searching through the internets, I found that most Airlines do not publish their on-time performance on their web-site. However, we can get some statistics from http://www.flightstats.com/. Although the figures at this website only reflect the 20 most active routes for each airlines, it shouldn't be much different from the actual values.

Here's the figures I get from the website for some of the best airlines worldwide:
(statistic period: 15-Aug 2007 ~ 15-Oct 2007)

Low Cost Carriers:

Air Berlin

80%
easyJet80%
Jetblue Airways 76%
Jetstar Airways81%
Southwest Airlines83%
Tiger Airways 85%

Full Service Carriers:

Singapore Airlines

84%
Thai Airways79%
Cathay Pacific Airways 75%
Qatar Airways73%
Qantas Airways73%
Malaysia Airlines76%

(It is quite a strange phenomenon that the LCCs perform better than those full service carrier. I guess maybe it's easier to be on-time for short-range flights. )

Unfortunately, the statistics about AirAsia at http://www.flightstats.com/ is incomplete, because it contains only figures for routes to Macau (which is about 65% on-time). This figures of single destination may be very different from the overall performance of AirAsia. For other routes which they don't have any data, they just quote 0% on-time-performance and 100% flight-cancellation. This does not reflect the real situation.

So, we can't double check the reliability of the on-time performance figures announced at AirAsia's website. However, according to my own experience (I've flown with AirAsia twice in September, and each flight I took depart on-time) and some of my friends' recently, I personally believe that error on the announced figures should be within 5%. So, lets assume that the real figure is 5% lower than the officially announced, the two-month-average performance of AirAsia (Aug & Sep-2007) still stand above80% (88% - 5% = 83%).

Conclusion: AirAsia on-time performance ranks among the best worldwide. Its performance is much better than those full service carrier like MAS, giving it an opportunity to grab a bigger market share in the future. I belive LCC model will continue to shake the aviation industry, and AirAsia will continue to grow and become the leading LCC in the reagion.

Related Posts Plugin for WordPress, Blogger...


SPONSORS: