31 December 2008

My portflio at the end of 2008

The composition of my portfolio at the end of this year:

portfolio_2008-12-31

In this quarter,

  • RM3000 was added into the investment account.
  • one stock had been sold: Supermx.
  • three stocks were bought: Lysaght, Sbagan, and MAS-PA.
  • trading of stocks: Tafi was sold at 43 sen, then buy back at 32 sen.

For the whole year 2008, my total return is about -36%, not much different from KLCI performance.

.

.

16 December 2008

Adjusted Balance Sheet for MAS.

This article is to illustrate the impact of the off-balance-sheet debt (the operating lease obligation) on MAS financial ratio.

The steps are simple. First, we capitalize those operating lease payments by calculating their present value (using the cost of debt as discount rate). Then we add the same amount of asset and debt onto the balance sheet, and recalculate the financial ratios of MAS.

Here we go.

from its annual report, we get the Operating Lease Arrangements of MAS as at 31-Dec-2007:

  • due within one year: RM 1.92 billion
  • due between one and two years RM 1.91 billion
  • due between two and five years: RM 3.23 billion
  • due after five years: RM 1.72 billion

To make things simple, we assume that all the payments are made at the end of each year, the RM3.23 billion is spread evenly over the three years, and the final RM1.72 billion is a one-shot payment at the end of sixth year.

Using a discount rate of 5% (estimated cost of debt for MAS) , we can get the present value of these cashflow -- about RM 7.5 billion. So, we adjust balance sheet of MAS by adding the same amount into both its asset and debt. The following table shows the impact of this operating lease item on MAS's financial ratios. (amounts are in RM billion)

As we can see, the debt and leverage ratio of MAS is much more bigger after the adjustment.

.

Comparison to Others.

Since there's only two airlines in Malaysia, we have no choice but to compare MAS to AirAsia. Before we make any comparison, the balance sheet of AirAsia also need some adjustment.

First, to be conservative, I think we'd better exclude the deferred tax asset from AirAsia's balance sheet. Including the deferred tax asset will overstate the asset of AirAsia.

Then, we adjust its balance sheet for operating lease payments. As compared to MAS, the operating lease items of AirAsia are much smaller in amount (only RM 0.23 billion) , and thus had little impact on its balance sheet and financial ratios.

Here's the figures of AirAsia: (amounts are in RM billion)

Many analysts tend to criticize on AirAsia's high leverage ratio, while MAS is normally thought to have a good healthy balance sheet. But if we compare the figures after the adjustment for operating lease, their financial ratios are not much different actually.

.

.

16 November 2008

The ‘Healthy’ Balance Sheet of MAS

While studying a company, many people will focus on examining the financial statements of the company, and tends to ignore the lengthy, multipages notes in its annual reports.

In this article, I just like to show an example, to demonstrate the importance of going through all those notes in order to get a correct picture on a company.

Recently, there are analysts keep calling that “it’s time to accumulate good quality stocks, their prices are so cheap and are undervalued.” Last week for example, I saw a buy list on news paper that recommended investors to buy companies with healthy balance sheet.

What surprised me is, Malaysia Airlines was listed top on the list.

Well, since the “professionals” suggested that MAS had a healthy balance sheet, I guess we should at lease have a glance on its financial statements.

According to its latest annual reports, the balance sheet item of MAS is as follow:

  • Non-current Assets: RM 2.63 billion.
  • Current Assets: RM 7.42 billion
  • Current Liabilities RM 5.25 billion.
  • Non-current Liabilities: RM 0.86 billion.
  • Equity to shareholders: RM 3.93 billion.

See any attractiveness in these figures?

Let’s go into more details. On its balance sheet, we’ll see that the current liabilities of MAS are mainly trade-payables and sales-in-advance, which are non-interest-bearing liabilities. The total debt (borrowing) of MAS is just about RM 0.9 billion, while it is holding about RM 5.3 billion of cash. In other words, MAS is having a net cash position of RM 4.4 billion!

Wow, this is really good, as the saying, a great balance sheet.

What’s the pitfall that lies behind this “healthy balance sheet”?

If you had gone through the footnotes in its annual reports, you’ll get some clue. MAS is actually having a huge amount of debt that is not reflected on its balance sheets -- what we called “off balance sheet items”. The most significant figures come from "operating lease arragement".

As we know, most of the aircrafts operated by MAS are not owned by itself. Instead, it leased the aircrafts from other parties and MAS had to pay rental fee on the aircrafts. The fact is, aircraft-leasing contracts are normally long-term arrangements, which are unlikely to be terminated earlier without penalty. Though they are not categorized as debt on the balance sheets, these contracts actually have the same effect as a real debt does on MAS’ cash flow -- MAS is obligated to make periodical payments on these contracts.

According to its FY2007 annual report (note 35, page-217), the amount of Operating Lease Arrangements of MAS at the balance sheet date are as follow:

  • due within one year: RM 1.92 billion
  • due between one and two years RM 1.91 billion
  • due between two and five years: RM 3.23 billion
  • due after five years: RM 1.72 billion

The total amount is RM 8.78 billion!

Taking these items into consideration, the financial position of MAS is nowhere near to ‘healthy’.

.

Let's end this article with some great definitions for financial jargons: (copied and pasted from Dali's blog.)

  • EBITDA - Earnings Before I Tricked the Dumb Auditor.
  • Off Balance Sheet Items - More important than items in the balance sheet, and represent things that really should be in the balance sheet.
  • Economist - Someone who tells you why their predictions went wrong after every quarter, and proceeds to give a confident prediction for the next 3 quarters.
  • Short Term Investor - Someone who is in-and-out within 3 days or less.
  • Long Term Investor - A short term investor who cannot get out profitably after 3 days.
  • Momentum Investing - The fine art of buying high and selling low with the crowd.
  • Value Investing - The art of buying low and selling lower.

.

09 November 2008

Get a 9% Compound Return with Minimal Risk

Few weeks ago, Burren Buffett investment in Goldman Sachs had got the attentions of Wall Street. Despite the bad economic outlook, the purchase of $5 billion preferred stocks with a juicy 10% dividend is said to be a great investment. It's said that only Warren Buffett can have the power to secure such a good deal.

But here, in KLSE, I had found a similar opportunity which can generate a 9% compound return in the next few years. And the best part is, the risk of this investment is very low.

What we had to do is just buying the Redeemable Convertible Preference Shares (RCPS) of Malaysia Airlines System at its current market prices. This RCPS is a product of MAS' debt-restructuring processes during year 2007.

Here's a short summary about this RCPS:

  • Issued at RM1.00.
  • preferred dividend: 3.0 sen per RCPS.
  • convertible to common share of MAS at RM4.05 by surrendering the RCPS. (period of conversion: four years starting from 1-Nov-2008)
  • at maturity date (31-Oct-2012), all un-converted RCPS will be redeemed at RM1.00.

.

The Potential Return

the RCPS is currently trading at around 70 sen. Assume that we bought it now and hold it until maturity, the average compound return will be at least 9% p.a. in the next four years.

If MAS decided to declare any dividend during the coming years, the holder of RCPS is entitled to received a preferred dividend of 3.0 sen per share. Then the return on investment will become higher, (up to 13%, if the preferred dividend is received in each the four years).

Furthermore, the RCPS is convertible to MAS common shares. As a result, while enjoying the above benefits, the holders of RCPS will not miss the opportunity to ride on the share market performance. If, by whatever reasons, the share price of MAS shoot up during the next four years, the price of RCPS should enjoy the same increase as well.

(the converible feature of RCPS may be the main reason why it's trading at such an attractive price now. People simply tie up its price to the share price of MAS. So, when the share price of MAS drop, the price of RCPS simply follow. By right, a preferred stock should be traded at a premium to its common shares).

For anybody who is interested to buy the stocks of MAS (and the share-holders of MAS), I strongly recommend buying RCPS (or replacing their common stocks of MAS with RCPS). Because the RCPS is currently traded without premium to the common share price of MAS. That means we are paying nothing for the above benefits of preferred shares if we buy the RCPS instead of MAS common shares.

.

Risk Analysis

If we are ready to hold the RCPS to maturity, there's only one risk risk that will cause us earning a return less than 9% p.a. -- MAS may be unable to redeem the RCPS at the maturity date. We have to examine the probability of this event.

According to its latest financial report, MAS is currently holding more than RM 5-billion of cash. The total number of RCPS issued was 417.7 million. Thus, MAS will have to pay out RM 417.7 million to redeem the RCPS if all of them are being held to maturity. That means, the cash currently held by MAS is actually more than 10 times higher than the amount needed to redeem the RCPS.

However, the huge amount of cash in MAS may reduce significantly in the coming years if the operating performance of MAS is very bad. But I have little worry about that.

One of the reasons is our government's policy that always protect the GLC's. Thus, despite the economic downturn and the increasing competitive environment, I think that the chance of MAS going into bankruptcy is very low. The second reasons is merely my confidence on the management team leaded by Idris Jala. I believe that with his Business Transformation Plan, Idris will turn MAS into a continuous profitable company.

.

Conclusion:

With a purchase price around 70 sen, the compound return rate on RCPS of MAS will be:
  • minimum 9% in the next four years,
  • between 9% ~ 13%, if MAS declare dividend,
  • even higher return if the share price of MAS go up.
While there's a risk that MAS may not be able to redeem the RCPS at maturity, I believe that the probability is very low.

.

03 November 2008

Profit of AirAsia (Part 2)

The main purpose of this article is to discuss why we should examine the economic performance of AirAsia from the perspective of the whole AirAsia Group, i.e. we should consolidate the statements of AirAsia with 100% revenues and profit/losses from TAA & IAA.

First, let’s have a look at the revenues and profit/losses of the three entities in AirAsia Group, presented separately in the following table (all figures are RM illion):

adjusted profit 3B

  • (the Jan-Jun 2008 revenues for IAA & TAA are not announced yet.)
  • * Adjusted PBT of AirAsia shown excludes non-operating items, but not including the profit/losses from IAA & TAA.

.

If we include the share of losses (48.9%) from TAA & IAA into AirAsia’s income, then AirAsia’s profit will be as shown in the following table (as discussed in my previous post):

adjusted profit 2

After these adjustments, the earnings of AirAsia will be about 8.9 sen per share (twelve months ended Jun-2008). If we accept this figure, then the current PE ratio of AirAsia is just around 12x, which is a very attractive level for me due to the high potential of AirAsia's earning growth in the coming years.

However, I still think the above adjusted figure is not reflecting the real economic performance of AirAsia. In my opinion, these figures may have been distorted by two factors – the asset allocation in AirAsia Group, and the transactions between the entities in the Group.

Let’s discuss them one by one.

.

1. the asset (aircraft) allocation of AirAsia.

As we know, currently there are two types of aircrafts in AirAsia Group – the old Boeing-737, and the brand new Airbus-320. And we know that the later is the more profitable one due to its oil-efficiency and low maintenance cost. So, the routes served by Airbuses are more profitable than those by Boeing, especially in recent periods of high oil price.

What happening in AirAsia Group is, the allocation of Aircrafts is not even among the entities in the Group. AirAsia Malaysia is operating almost all the Airbuses, while the old Boeings are being pushed to TAA and IAA.

For example, according to the figures announced for the quarter ended Jun-2008, out of the 39 airbuses in the Group:

  • 35 of them are allocated to AirAsia Malaysia,
  • only five are in TAA,
  • and none in IAA.

few weeks ago, AirAsia announced that all its routes in Malaysia are now operated by new Airbuses.

In other words, AirAsia pushed the non-profitable assets to its associates, and retained the most profitable assets within Malaysia. This might be one of the reasons why TAA and IAA are suffering continuous losses while AirAsia is making great profit.

So, if we adjust AirAsia’s income statement using only 48.9% share of losses from TAA and IAA, we are giving more weight on the Airbuses, and have a lower weights on the poor-performing Boeings. As a result, we will get an upward-biased figure about the Group’s performance.

Some people may argue that AirAsia Group is replacing all the Boeings with Airbuses. Thus TAA and IAA might become as profitable as AirAsia (Malaysia) after the replacement. So, the upward biased figures of AirAsia’s statements is a more accurate measure of Group’s future performance (After all, the future performance should be most concern to the shareholders, right?)

I will not agree to this argument. Though AirAsia is accelerating the retirement plan of the Boeings, it will take several years to complete the plan. By then, the new Airbuses today may become aged, and their maintenance will become higher, and who knows, they may just become like the old Boeings today. So, to be consecutives, I think we’d better use today combination of assets (a mix of new and old) even when we are estimating the Group’s future performance.

.

2. The transaction between TAA, IAA and AirAsia. (the Aircraft Rentals)

As we know, all the aircrafts of the Group are owned by AirAsia. So, to operate those aircrafts, TAA and IAA have to pay rental fees to AirAsia. This is another part that may distort the reported performance of AirAsia.

When AirAsia receive rentals from TAA & IAA, it’s recorded as an income, which is off course 100% reflect on AirAsia’s earnings. So, the higher the rental, the more it benefits AirAsia. But from the view of TAA or IAA, these rentals are expenses. That means a higher rental fees will reduce their profit (or increase their losses), i.e. a higher fee will have a negative impact on them and thus AirAsia.

Again, because AirAsia owns 48.9% stake in TAA and IAA, only half of the rental expenses in TAA and IAA would be consolidated into AirAsia’s statement, while 100% of AirAsia’s rental income will be reflected on the same statement. So, by simply charging a higher rental fee, AirAsia could increase its reported earnings without improving its operating performance.

From the perspective of the whole AirAsia Group, the rental fee among entities shouldn’t have any effect on the overall performance. So, we should consolidate 100% of the revenues and profit/losses of TAA & IAA into AirAsia’s statement, to get a clear picture on the Group’s operating performance.

.

Conclusion:

By treating three entities as a group, we can eliminate the potential distortion of AirAsia’s economic performance from both its asset allocation policy and the aircraft rental fees.

The following table shows the 100% consolidated revenue and profit/losses for AirAsia Group. Profit margins of AirAsia (Malaysia only) are included in the table for comparison purpose. (Revenues and PBT are in RM million, Margins are in %).

adjusted profit 4B

  • The 3rd column (AirAsia Margin) is calculated using PBT reported in AirAsia’s statement.
  • The 4th column, Adjusted AirAsia Margin, are reported figures excluding non-operating items (the foreign exchange gain and selling of interest rate swap contracts), and not including profit/losses from TAA and IAA.
  • the Group’s PBT and Margin are also excluding non-operating items.

From the table, we can see that the overall profitability of AirAsia Group is much lower than the figures reported in AirAsia’s statement (which only reflect the non-consolidated profit of AirAsia in Malaysia).

.

29 October 2008

Profit of AirAsia (part 1)

This article is some discussion about AirAsia's reported profit. By pointing out some accounting pitfall in its statements, I hope that this article can present a more accurate picture about the profitability of AirAsia.

Before we start, let's have a glance on the profit reported by AirAsia in recent years:

  • FY 2006 (ended June-2006): RM 86.2 million
  • FY 2007 (ended June-2007): RM 278.0 million
  • 6-month ended December-2007: RM 276.7 million
  • 6-month ended June-2008: RM 63.3 million

* (Last year, AirAsia changed its financial year end from June to December.)

All the figure above are PBT (profit before tax). I think PBT is a more accurate measure of AirAsia's profit because its after-tax-profit figures are highly distorted by the "deferred tax" item. (For more about this, please read: My Mistake - the "Defered Tax" in AirAsia's profit )

Nevertheless, there are two things we had to be cautious about these PBT figures.

.

1. Special Income.

First, we should adjust the profit against non-operating income. A significant item in AirAsia's statements is the "foreign exchange gain". As we know, AirAsia has huge amount of loans that is denominated in USD. As a result of USD depreciation in recent years, AirAsia had recorded some "foreign exchange gain". However, most of these "profits" are just accounting gain, which won't generate any real cash flow or economic value.

This is because AirAsia had entered into some foreign exchange forward contracts, which help it to hedge against the appreciation of USD (these contracts had swap the future repayments of AirAsia's loan from USD into Ringgit). So when USD depreciates and the loan amount of AirAsia is decreased, AirAsia should suffer a comparable amount of loss in the value of its hedging contracts. The problem in AirAsia's income statement is, it only regconized the exchange gain from the decreased amount of loan, and doesn't take into account the loss of its foreign exchange contracts (they are "off-balance sheet item" and not reflected on income statement).

Due to some reasons, (e.g. AirAsia is not doing 100% hedge on its loan amount, the fair values of forward contracts also affected by market activities, etc.), the actual gain/loss from foreign exchange rates are more complicated. However, it's quite sure that the real total gain/loss is much smaller than the figures reported in AirAsia's income statement. So, to be conservative, we'd better exclude all the foreign exchange gain/loss to get a clearer picture on AirAsia's profitability.

Besides the foreign exchange gain, AirAsia had also recorded a gain from selling some interest-rate swap contracts during FY2007.

The adjusted profit of AirAsia, excluding those special items, are summarized as follow : (all numbers are RM million)

adjusted profit

.

2. The Losses in Thai AirAsia (TAA) and Indonesia AirAsia (IAA).

Until today, TAA and IAA still suffering loss.

AirAsia owns 48.9% stake in TAA and IAA. Thus the same portion of losses from these two entities should be reflected on the income statement of AirAsia. However, AirAsia had stop recognizing these losses from both TAA and IAA.

Again, it's because of the accounting method used.

AirAsia's investments in TAA and IAA are accounted for in its consolidated financial statements using equity method of accounting. The following paragraph is extracted from AirAsia's annual reports:

  • The Group discontinued recognition of its share of further losses made by Thai AirAsia as the Groups interest in the jointly controlled entity has been reduced to zero and the Group has not incurred any obligations or guaranteed any obligations in respect of the jointly controlled entity.

Though some people may argue that the equity accounting is a suitable one, I think that the profit/loss of TAA and IAA should be included in AirAsia's statement to fully reflect its profitability.

The reason is simple. First, TAA, IAA and AirAsia are operating as a group (e.g. they share the same ticket booking system), thus they should be considered as parts of a whole body. Second, AirAsia is leasing its aircrafts to TAA and IAA, so they have to pay rental fee and maintenance charge to AirAsia. If their operation continue to face difficulties, it's possible that they will postpone the payments or, worse, fail to meet their payment obligation. Thus, the fact that TAA & IAA are "limited company" doesn't stop AirAsia from bearing the risk of their further losses.

The following tables list the related parties transactions between AirAsia and TAA & IAA, a simple illustration about their relationship.

1. AirAsia's income (RM million) from TAA and IAA:

adjusted profit 5

2. Amount of money that TAA & IAA owe AirAsia (RM million):

adjusted profit 6

.

Conclusion:

To have a fair evaluation on AirAsia's profitability, the non-operating gain/loss should be excluded, and the profi/loss from TAA & IAA should be included. Thus, the real profit of AirAsia in the past few years should be as follow:

adjusted profit 2

(* the first column is the adjusted profit excluding non-operating item).

As we can see, these figures are much smaller than the PBT reported in AirAsia's income statment.

.

...... continue reading : Profit of AirAsia (part 2)

.

11 October 2008

Lysaght Galvanized Steel Bhd

This week, I bought two more companies into my value-stock portfolio: Lysaght, and Sbagan.

Lysaght Galvanized Steel Bhd.

According to its Jun-2008 report, Lysaght's net working capital per share is about RM 1.34. I bought it at RM 0.85 per share, a discount of about 37% from its net working capital.

Others criteria of Lysaght:

  • zero debt.
  • low PE ratio. (around 6, three years average)
  • stable growing revenue and profit in recent years.
  • good dividend record. (net DY about 4.7%, three years average)

As most others company in my value-stock portfolio, Lysaght also has a very low trading volume in KLSE.

.

Sungei Bagan Rubber Company (M) Bhd

I bought it at RM2.40 per share. Sbagan is a special case in my value-stock portfolio. instead of net working capital, it's selected based on its total asset value. This is because it is a cash rich company, and most of its other assets are quite solvent.

According to the quarterly report of Jun-2008, Sbagan hold a cash amounted RM 142 million, equivalent to about RM 2.35 per share. That means my investment in Sbagan is paying almost solely for its cash only. Other assets are all free.

According to the quarterly report, Sbagan’s hold some investments worth about RM 170 million at Jun-2008. These assets are equal to about RM2.80 per share. Since I’m getting these assets for free, I won’t feel panic in the coming economy crisis.

Just assume that the market value (or NAV) of all these investment asset will be falling for another 50% from their level at Jun-2008, they will still worth about RM85 million (equivalent to RM1.40 per share of Sbagan). Even based on this discounted value, my buy price is still more than 30% below Sbagan's total asset value.

For detailed analysis on Sbagan's asset, please read my post: Sbagan - a candidate for value-investing.

.

10 October 2008

My portfolio at 30-9-2008

The composition of my portfolio at the end of September is as follow:

portfolio_2008-09-30

I didn't add any money into my account during this quarter. At the end of September, I sold all my holding on Supermx.

I need cash to build my “value-stock portfolio”. Since I don't have extra savings during these months, I'd decided to sell one of my holdings. Compared to the other two companies that I invested (Titan and AirAsia), the management of Supermx is the one that I have least confidence in it. So, it become the first company I decided to sell when I need cash.

Rubber-glove manufacturers are still one of my favorite companies to invest. I’ll come back to them when I have extra cash savings. However, the next time, I think I may be more interested in Kossan instead of Supermx.

My evaluations on the glove manufacturers had changed during this year, mainly influenced by Fisher's writing Common Stock and Uncommon Profit. I had just done my reading on the book few months ago.

.

06 September 2008

Seni Jaya Corporation Bhd

This is another company that I bought into my value-stocks portfolio yesterday. My buy price is 53 sen per share, which is about 75% of its net working capital.

Other good criteria in this company are:

  • zero debt.
  • stable revenue and profit since year 2001.
  • Good dividend. Its latest dividend payment is 5.0 sen (less 26% tax) per share, which had been paid out few weeks ago. Compare to my buy price, this figure give a net DY of about 7%. (Dividend in previous years are less, but quite stable).
  • Plenty of Cash (about 60 sen per share).

Similar to other companies in my value-stock-portfolio, SJC has a very low trading volume. I've been watching and quoting for it since few months ago, but only managed to get a match on yesterday.

UMS Holdings Berhad

Few months ago when I discovered this stock, it is reported that there's a fire incident occured at the company's store in February 2008. I decided not to buy it because the impact from the fire incident was unknown.

Last week, its lasted quarterly report (Jun-2008) said that the extent of damage to date was approximate RM389,000 only, which is, in my opinion, not quite significant to the company's operation. So, I decided to select it into my value-stocks portfolio.

I managed to buy UMS at 70 sen per share yesterday. According to its latest quarter-report, this price is only equal to 60% of its net working capital per share. Other factors are:

  • very low debt. (borrowing/equity less than 10%)
  • stable profit in the past seven years.
  • net DY more than 5% in the past four years.
  • low PE ratio. (about 5, based on three years average EPS)

.

Caution about this company:

  1. It has high amount of receivables and inventories, compared to its yearly earnings. Both figures are about 4 times of its PAT. However, when compared to its revenue, these figures are still acceptable. The inventories and receivables are maintained around 40% and 30% of its revenue respectively.
  2. There may be some consequential loss (due to the fire incident described above) that yet to be finalized. In my opinion, it shouldn't have any significant impact on the company. However, I may be wrong.

.

28 August 2008

Kim Hin Industry Bhd

Two days ago, another company is selected into my "value stock portfolio".

Kim Hin is a company located at East Malaysia, mainly involve in manufacturing and sale of ceramic tiles. I bought it at the price of RM1.15 per share, which equals 88% of its net working capital.

other supporting reasons:

  • zero debt.
  • continuous profit for many years (one exception occur at 1998).
  • uninterrupted dividend payment for more than 10 years.
  • cash per share of about 53 sen. (base on its Mar-2008 quarterly report).

.

Special Item:

Under the list of its non-current assets, there is an "other investment" item worth about RM 67 million. (base on Kimhin's Mar-2008 quarterly-report)

According to the footnotes in the report, this "other investment" item is mainly made up of bonds, fixed income funds, structured products, etc. All of them are very low risk investment. And in my opinion, they can easily be converted into cash!

If we treat them as cash, then the total cash in Kimhin will become RM 1.0 per share. And if we include the value of these investment into its current asset, then the net working capital of Kimhin will be more than RM1.70 per share. That means my buy price of RM1.15 would be just about two third (67%) of its net working capital, (exactly the Graham's ratio).

.

07 August 2008

Perak Corporation Bhd

PRKCORP, a new company that I've just added into my "value-stock" portfolio this week.

I bought it at the price of RM0.75 per share. According to its Mar-2008 quarterly report, its net working capital per share is about RM2.25, which means that my buy price is only about 35% of its net working capital, thus provide a good margin of safety.

Other supporting reasons:

  • Cash per share about 80 sen. (as Mar-2008)
  • Price-earning ratio is only about 6, calculated from latest 3 years' average EPS.
  • Continuous profitable since 1995, including years after the 1997 economic-crisis.
  • consistence dividend payment since 2000. (though the dividend yield is quite low).
  • It main profit come from the business in Lumut Port, which I think is a locally monopoly business.

.

However, there is one thing in PRKCORP that is quite different from my other "value stocks" -- It is not a debt-free (or very low debt) company. In other words, it doesn't meet all the requirement that I have listed out for this portfolio.

Though I think that the very low price/net working capital ratio has given me a good margin of safety, there are few more things that have to be take note:

  1. the figures for net working capital and cash per share stated above, they are just the group consolidated figure. I didn't take into account the minority interest.
  2. The huge cash that PRKCORP held is actually still less than its total borrowings, which means it's not in a net cash position. So, I see the Cash as an indicator of financial health (i.e. its profit is generating net cash inflow), rather than a strong safety factor.
  3. The very big portion of PRKCORP's current asset is actually receivables and property development cost. The amount from each of them is higher than the revenue of the company (or, in other words, a few multiples of the company's annual profit).

.

11 July 2008

Ya Horng Electronic (M) Bhd.

This is the new stock that I’ve added into my “value-stock portfolio”.

I bought it at a price of RM 0.550 two days ago. According to its latest quarterly report (April-2008), its net working capital per share is about RM 1.32, which is more than double of my buying price!

Other criteria found in this stock are:

  • Zero debt. (no borrowings)
  • Cash per share of about RM 0.65. (at Apr-2008)
  • Low PE ratio (about 6, three year average)
  • Consistent, uninterupted dividend payment for many years, and net DY > 5% in each of the past ten years (according to my buy price of 55 sen).

I bought the stock just few days after the execution date of its latest dividend (5 sen less 25% tax). So, I didn’t enjoy the latest dividend, and its cash per share should be around 61 sen now. However, my buy-price is still about 10% lower than its cash value.

There are also some negative sides of this stock:

  • Its inventories and receivables is very high compare to its PAT. But they are still acceptable if compare to its revenue.
  • Its profit margin is very low (about 2% in the past two years), and the margin show a decreasing trend in the past ten years. Some may say that it's in a "sun-set industry".
  • The liquidity of its stock (trading volume) is very, very, very low.

The last point is the main reason why I didn’t buy it earlier though I’ve discovered it few months ago -- my quotation just couldn’t be matched.

.

10 July 2008

Selling Stock

This is the first time I've decided to sell my holdings since I started this blog.

In the beginning of July, two stocks in my portfolio had been sold.

.

RUBHD

Sell at RM3.48.

Though I think that it should worth more, I don't think that the price of the take-over offer by Ranhill will be revised to a higher price. So, to save my time and utilise the money for other investment opportunity, I have decided to sell it.

.

AKN

Sell at the price of RM 0.385.

A friend had decided to buy AKN after reading my blog. Then we started some discussion in a forum. During the discussion, some other friends give us warning signals about the integrity of its management. Though I can't be sured that they are right, I think that selling off AKN is the best way to protect my self.

However, I’ll keep observing the future development of AKN.

.

My portfolio at 30-6-2008

Here's my portfolio at the end of June this year:

portfolio_2008-06-30

Note:

I've added RM 1050 into my portfolio in this quarter. The money was used to buy another 1000 shares of AirAsia. Other composition of my portfolio remain unchanged.

.

15 June 2008

Why I'd never worried about AirAsia's debt.

One of the reasons that investors don't like AirAsia is the huge amount of CAPEX and borrowings.

In this article, I'll discuss how good is AirAsia in managing its debts.

1. Interest rate hedge

Interest rate hike is a essential risk for highly debted company. AirAsia hedges against the risk by entering into interest rate swap contract that will convert almost all of its debt into fixed rate debt.

According to its Dec-2007 report, AirAsia’s swap contract obliges it to pay fixed interest rate of between 4.78% and 4.90% instead of being subjected to the floating US-LIBOR for the entire loan amount over the entire tenor.

The hedging of interest rate will stabilize AirAsia' future cash flow, and help it to maintain the current low interest rate throughout the whole repayment period.

2. Forward foreign exchange hedge

As the borrowings of AirAsia are all in USD, it will benefit from the depreciation of USD. Moreover, Airasia had entered into forward exchange contracts for settlement at fixed Ringgit rates when the USD had depreciated.

For example, as disclosed in Dec-2007 report, AirAsia had swap its RM3.3 billion equivalent debt into ringgit at exchange rates between RM 3.000 ~ RM 3.369. Because the exchange rate of USD to Ringgit is much higher when it borrowed the money, AirAsia is actually making a profit from the repayments of principal loan amount.

These profits from foreign exchange had been recorded in AirAsia’s income statement. In the latest quarterly reports, we can see that the financial cost of AirAsia is a positive value (which means it’s an income, not expenses). This is because the foreign exchange gain from the repayment of debt is higher than the interest expenses.

The following table shows AirAsia’s interest expenses & foreign exchange gain during pass two years.

foreign exchange gain

And the most important part is, these exchange profit are recurring! (because AirAsia had swapped its debt into ringgit at a favorable rate.) With this recurring income, I never doubt the ability of AirAsia to pay the interest of its loan.

3. Tax Incentive

AirAsia has been granted a great amount of tax incentive from our government, for its CAPEX in purchasing aircrafts.

How much is the tax incentive? Let’s look at the recent figures.

Tax incentive

From my own estimation, for every dollar AirAsia spent in purchasing aircrafts, the tax incentive incurred is enough for it to pay the loan interest for at least 3 years! As the repayment period of AirAsia’s loans are only 12 years, the tax-incentives had actually helped to cover a substantial part of its financial cost.

So, why not borrowing?

Let’s look at this tax incentive from another angle of view. The following table shows the PBT of AirAsia and the tax it should have paid if there’s no incentive:

Tax

And the actual taxes paid by AirAsia during this period are:

  • FY2006:RM 2.2 million.
  • FY2007:RM 5.1 million
  • July-Dec 2007:RM 1.5 million

Can you see how much tax savings had AirAsia been enjoying? This a main reason why I've never worried about the high CAPEX of AirAsia.

In fact, the fast expansion of AirAsia, leveraging on financing facilities, is one of the factors that enable AirAsia to maintain its profitability. Because in the highly competitive LCC industry, only the lowest cost player (through effective cost reduction, economic scale, and fast penetration into the market) will survive and prosper.

Since it's able to manage its debts so well, I think AirAsia's way of expansion (through borrowings instead of issuing new shares) is the best way to benefit the shareholders without diluting our interest in the company.

.

[updated 29-10-2008]: There's a serious mistake in this article -- the foreign exchange gain reported in AirAsia's income statement is not a real gain. Though I don't know the exact figure, I'm quite confident that AirAsia's actual (recurring) exchange gain/losses should be much smaller than the figures stated in this article. For more detail, pls read my post: Profit of AirAsia (part 1).

.

10 June 2008

Comment about Mar-2008 quarterly reports

AIRASIA

The result is better than I expected. Its operation in Indonesia and Thailand is improving despite the escalating oil prices. The environment for airline industry has become more and more challenging in this year. The record-high oil price and tough competitions in the industry will kick out some of the players, and those who survive——and I think AirAsia is surely one of the them——will benefit from it.

As I said, I will gradually increase my investment in AirAsia (up to the limit of 25% of my portfolio’s value). Currently, the only thing that worried me is the continuous drop of AirAsia’s load factor, which is about 68% in this quarter. However, I’m in confidence that it would be improved in next year, as a result from the ASEAN's sky liberation.


AKN

It surprised me with a proposal to sell off the businesses in Paramount Discovery. Its acquisition of Paramount Discovery about two years ago is one of the main reasons I invested in AKN. However, the proposed selling price of RM126.9 million is about four times higher than the acquisition price about two years ago. This means AKN will have a gain of about RM100 million in this transaction, which is equal to earning per share of about 80 sen.

This will help AKN to reduce its debts, cut the financial cost (hence improve its profitability), and achieve a healthier balance sheet. I hope these will boost AKN share price to a high level after the transaction is done, because I’m considering to withdraw my investment from AKN then.


RUBHD

The revenue and profit remain stable, as expected. Its reaction to WSIA remains uncertain. The scheduled tariff hike in Jan-2009——which is expected to boost its profit next year by at least 30%——remains the key reason for me to hold RUBHD.

But then a shockin news was announced last week, that Ranhill Berhad made a take-over offer on RUBHD. The offer price is only RM3.50 per share, which is 20% below its NTA. I really hope that this privatisation will fail, because RUBHD definitely worth much more than RM3.50!


SUPERMX

Revenue and profit is growing as expected. But the profit margin is decreasing, which is a warning signal to me. Although I feel that its current share price is very cheap as compared to its value, I'll rather stop accumulating Supermx. This is simply because the value of Supermx already made up a high percentage in my portfolio (about 25%). Currently, I need some diversification in order to reduce the risk of making mistake.


TITAN

As expected, Titan remain profitability despite the high oil price, and the polymer-naphtha spread is quite stable. I’m very happy to see the start-up of the butadiene plant and propylene plant has been carried out smoothly. Also encouraging is the increasing output from the Indonesia’s plant. The next step of Titan is the debottlenecking process of its polypropylene plant, which is expected to boost its Polypropylene capacity for another 100 KTA, by the end of this year.


"Value-Stocks" Portfolio - TAFI & ADVPKG

Advpkg had declared a tax-exempt dividend of 4.5 sen per share. This means I’m enjoying a net dividend yield of about 8% this year, which is higher than I expected. Maybe due to this higher dividend, its share price has been advance for more than 20% from my buy-price. However, I’m in the opinion that its current share price of about 70 sen is still under-valued.

Despite the declining revenue and profit,TAFI's share price remain quite stable.


16 May 2008

Sbagan - a candidate for value-investing.

NOTE:

This company was recommended by a member from the forum chinese.cari.com. Then I did some research on it, and surprisingly found that Sungei Bagan is not a plantation company. This article is actually a summary of what I’ve published on that forum. (Those who understand chinese, welcome to pay a visit there.)

Today, I decided to join a forum named The Value Circle. It’s not an open forum, which means only selected members are eligible to view the posts. To join this forum, an analysis article of at least 500 words had to be submitted for approval. As a lazy-man, I just rearranged my opinion about Sungei Bagan into the required format, and translated into English, before doing my submission. I hope that they will approve my application.

I just made a copy of my submitted article here(with little changes). It’s a bit long, enjoy your reading!!!

.

Elevator Pitch:

Most of the people may think Sungei Bagan is a plantation company.

Well, while it’s still running its palm oil business, its investment holding activities has now become the most important parts of this company.

If we have a look at its earning, we’ll find that the operating income from its plantation business is actually quite small, even less than the interest gain from its cash holding. The growth of the company’s equity is now more rely on the dividend income and capital gain from its investment. This capital gain from its investing activities is not stated in the company’s income statement.

From the asset view, the fixed properties only contribute less than 10% of its total assets. More than 50% of its asset is the investment in quote shares, and about 40% is cash.

So, when evaluate this company, we should pay attention to its assets and equity growth.

.

Value Proposition:

In the financial reports on and before FY-2006, the values of Sungei Bagan’s assets are hidden from its balance sheet. This is because most of its investment holding are recorded at cost instead of market value. Starting in FY2007 annual report, the company changed its accounting standard, from then the values of its investment had been reflected on its balance sheet. However, few people noticed about that.

Here’s my summary about Sungei Bagan’s equity.

Fixed Assets.

Sungei Bagan only has two properties.

One of them is the oil-palm estates. According to its report, now Sungei Bagan own 2,744 acres of estate, which is recorded at a book value RM1.36 million. This is surely under-valued, because the last revaluation of this estate was done on 1959. Today, oil-palm estate is worth at least RM 10 thousand per acres, which means the values of Sungei Bagan estate should be more than RM 27 million.

Another asset is a 999-year lease-hold apartment located in London. Sungei Bagan bought this asset in 1997 at a price of RM 7.4 million. Today, it’s recorded at a book value of RM24.5 million. This growth is probably a result of properties bubble. So, for conservative valuation, I think we better revise the value of this apartment back to its buying cost, i.e. RM 7 million.

So, the revised value of Sungei Bagan’s fixed asset should be around RM 35 million. This value show that the fixed assets only made up of about 10% of the company’s equity. ( about 50 sen per share.)

Investment in Quoted Shares

Sungei Bagan has investment in both local and overseas stocks.

In Malaysia, it only invest into two stocks, namely Kuchai and Kluang. Today, Sungei Bagan is 9.38% shareholder of Kuchai, and a 5.98% shareholder of Kluang. The amount of shares held has not been changed for many years. In the FY2007 reports, the market values of these shares is about RM23.3 million.

For the shares outside Malaysia, I’ve no idea about the composition. According to the company’s report, these shares had a market value of RM 91.5 million at Jun-2007.

Sum up the local and overseas holding, the company investment in shares is valued RM 114.7 million.

Investment in Associates

This investment consists of two parts—unquoted shares, and quoted shares.

The book value of unquoted shares is only about RM 6.3 million. So, I think we can ignore this in our analysis.

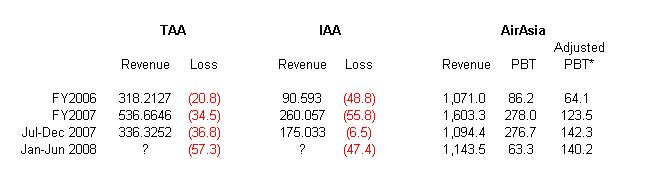
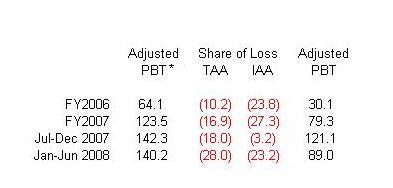
The quoted shares worth about RM 74.0 million at Jun-2007. This is actually the NAV of its shares in Raffles-Asia Investment Company (RAIC). Sungei Bagan holds about 32% of RAIC, which is actually a closed-end-fund. RAIC is managed by a Singapore’s fund manager, namely Charted Asset Management Pte Ltd. ( website: http://www.cam.com.sg/ )

According to its latest report, RAIC’s portfolio consists of stocks from Singapore, Hongkong, Indonesia, Korea and Malaysia. RAIC declared dividend to its share-holders every year, and most of the time Sungei Bagan would reinvest the dividends into the fund.

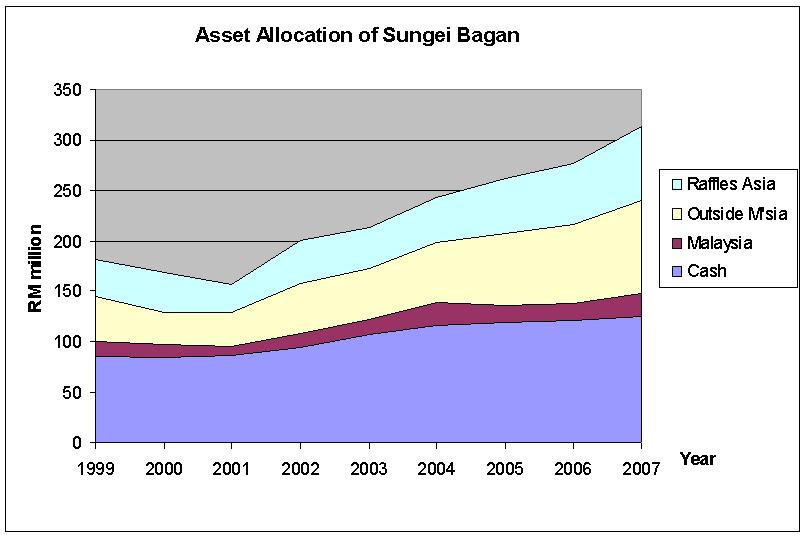
Historical Growth of Sungei Bagan’s portfolio.

Sungei Bagan is holding a huge amount of Cash — RM 125 million, equivalent to RM 2.07 per share.

In the following table, I’ve include the amount of cash and the market values of the quoted shares held by Sungei Bagan in the past few years.

(value stated in RM million)

sbagan equity table

.

The following graph shows the growth of Sungei Bagan's portfolio:

sbagan equity

From the table, the value of Sungei Bagan’s portfolio has shown a CAGR of about 7% in these years. The value of this portfolio at Jun-2007 is equivalent to about RM5.20 per share. Now the market price of Sungei Bagan is about RM2.80 per share, which is quite low as compared to its assets.

.

Valuation:

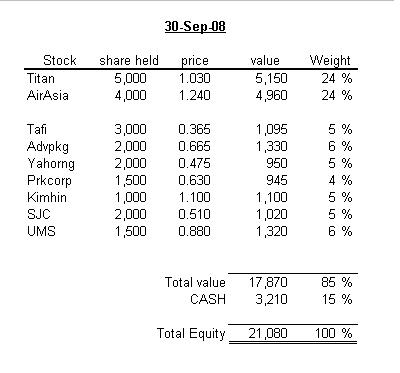
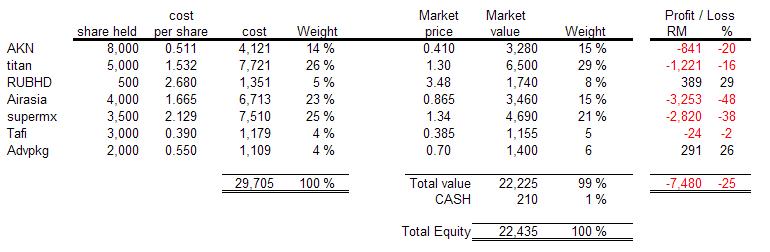
According to the Q2-FY2008 report, the combination of Sbagan’s portfolio at Dec-2007 was as follow: CASH RM 132 million, Quoted Shares RM 107 million, NAV of Raffles Asia (approximate) RM 70 million.

Total value of this portfolio is about RM 309 million.

Due to the current economics climate, many are expecting that the stock market will continue to fall. So, to be conservative, let’s make a 50% discount on the value of quoted shares held by Sungei Bagan. This will reduce its portfolio value from RM 309 million to about RM 220 million, which is equivalent to about RM 3.60 per share.

So, Sungei Bagan’s current share price of RM 2.80 is surely lower than its value.

.

Risk

Because a big part (about 60%) of Sungei Bagan’s portfolio is investment in stock market, its equity will shrink when the stock market is going down. This is the risk that we had to consider.

However, with its current combination of equity, even if the stock market plump 80% from JUN-2007’s level, Sbagan’s portfolio would still worth RM 2.70 per share. If we add in the value of its fixed assets, Sungei Bagan share should worth at least RM 3.0 in this worst scenario.

.

Driver:

If we accept my valuation of RM3.60 per share as the intrinsic value of Sungei Bagan, then the current share price of RM2.80 will give us a safety margin of about 20%. This may not be enough for some conservative investor.

What we can do now is just keep it in the watch list. In my opinion, some event in the near future, e.g. the burst of palm oil price bubble (I believe that it’s just around the corner) would probably give us a best opportunity to buy in Sungei Bagan with a very satisfactory margin of safety.

.

Clonclusion:

Intrinsic value: RM3.60

Classification: Asset Play.

.

21 April 2008

My Portfolio at 31-Mar-2008

Haven't update this blog for almost a month... quite busy during these few weeks...

So, here's my portfolio's value at the end of 1Q-2008:

Portfolio-2008-03-31

Comment:

1. A cash of about RM1550 (mainly come from my bonus salary) had been added in to my portfolio during this quarter. Due to its very attractive price, I had increased my investment in Supermx to 3500 shares, as compared to 2000 shares in the last quarter.

2. As mentioned in my previous post, Tafi & Advpkg were selected into my "value-stock" portfolio due to Graham's asset-orientated valuation.

3. I didn't see any big change of fundamental condition in my companies, except for AirAsia which has doubled its EPS in the 1H-2008.

4. Due to some negative emotions in the market, my companies are now being transacted in very attractive prices. I really want to increase my investment in these companies (and some new candidates that I've been monitoring so far). But unfortunately, this few months I'm facing some difficulty in my personal finacial management, where I'm spending almost every ringgit that I earn, leaving no cash for my investment. I hope that this condition will not last for too long, because I really don't want to miss this "mega-sales" of stocks in the current investment climate.

.

18 March 2008

Two value-stocks: ADVPKG and TAFI

Here, I 'd like to introduce two stocks, which I picked into my value-stocks portfolio.

Advance Packaging Technology Bhd.

Last week, I bought this counter at a price of RM0.55. Its net working capital per share is about RM0.81. Hence the price/net working capital = 0.68, giving me a quite satisfactory margin of safety. Others factors that make it a value-buy are:

  • Zero debt.
  • Stable Revenue and profit in the pass ten years
  • Consistent dividend payment. (the average net DY is about 5%)
  • Plenty of cash in the company. (Cash per share = RM0.63)

Its PE ratio is about 9, not very attractive. But with the above criteria, I think buying this stock with RM0.55 is a good and safe investment.

.

Tafi Industries Bhd

I bought this counter at the beginning of March. With a buying price RM0.39, its price/net working capital is about 0.93.

Some good criteria found in this company are:

  • Zero debt.
  • consistent, and relative high dividend. (three years average of net DY = 7%)
  • Low PE ratio. (three years average PE = 5.4)

Besides, its profit shows a gradually growth during the past three years. Hence, with its low PE and good DY, I'm willing to have it in my portfolio although the margin of safety is not that much.

.

16 March 2008

My New Portfolio – with the Graham’s Value-approach.

As I mentioned few months ago, I’m planning to swift my stock-selecting method to Graham’s way. Thanks to Hong Leong Broking which maintains its minimum brokerage fee at RM12, allowing me to buy stock at smaller lots, with low transaction fee. Last month, I’ve opened a trading account with HLeBroking, and I’ve started this portfolio in the early of March.

The purpose that I set up this portfolio is to carry out an “experiment”, to test whether I could generate a good return with this approach. In his 48-years of investment life, Walter Schloss has showed that Graham’s method can give an compound return rate of 20%p.a., almost as same as Buffett’s record.

In this separated portfolio, I will select a number of undervalued stocks, simply based on their assets. I’m not going to study deeply into their business model, nor am I going to make a detail analysis about their future prospect. I’ll just concentrate on figures, not people. Everything is based on the historical data, not future forecast. More attention will be paid on analyzing their assets instead of earnings.

Before I started this portfolio, I had listed down some rules for the screening purpose:

First, I’m not going to invest into a property or plantation company. This is simply because I don’t have confidence in estimating the value of land-properties. However, I’ll still invest in such a company if it consists of high-liquidity-assets, and its share price below the value of these assets.

All the companies selected into this portfolio must have a price lower than its net-working-capital. Here, I’m using Graham’s definition, where “net-working-capital” equals to current assets minus total liabilities. As we know, Graham suggested to buy into stocks which is priced below two third of its net-working-capital, leaving a 33% safety margin. However, I think this rule is too strict, where I hardly find a counter on KLSE that comply with it. So, I use a lower standard-- price below net-working-capital as my first screening filter.

Since my requirement on net-working-capital is less than what Graham suggested, I have to set a few more screening criteria to lower my risk of investment. Some of them are:

  • no debt (or very little debt).
  • the PE ratio must be lower than 10.
  • has a consistent record of dividend payment.
  • not suffering loss during the past few years.
  • the current price level should be at least 25% lower than its peak in the last 24 months.

I hope that I could find at least 10 counters from KLSE which can meet all the above stated criteria. I'll invest about RM1,000 in each of them, to form a diversified portfolio of value-stocks. Of course, I understand that ten counters is not actually diversified enough, but currently I only have about RM10 thousand budget for this.

Due to the low invest amount in each counter, the transaction fee (in and out) will be a bit higher, about 2% ~ 3% of invested amount. But if this portfolio can generate an average return of 20% p.a., I don’t think that transaction fee is a big matter.

To find a stock that meets all the above criteria is not an easy job. Currently, I have only four candidates in my hand. I’d already invested into two of them, in the beginning of this March (I’ll discuss them in my next post). I'll continue the searching until I've found ten of them.

TaTa...

.

08 March 2008

Comment on Quarterly Reports 31-DEC-2007

AirAsia

Showing a good great result despite the high oil price, half-year profit shows an increase of more than 100%. There's a foreign exchange gain of RM 134 million included in the half-year PBT of RM 276 million. Excluding this item, the half-year PBT will be only RM 142 million (about 6.0 sen per share). AirAsia only hedge 30% of fuel for the period until Jun-2008, quite a worrying figure. However, the losses in IAA and TAA had been improved in the quarter. With the newly delivered Airbuses, I believe that they will become profitable soon. I've decided to hold the share of company, but not going to increase my investment unless the price fall below RM1.40.

.

AKN

It suffered a loss of RM 2.3 million in the quarter. This is due to the provision for diminution in value of investment in Subordinated bond of RM2.425 million, and the loss on sale of marketable securities of RM4.58 million as a consequence from the winding down process of the DDD subsidiaries in HK and China. Excluding these special items, the group would have generated a PBT of RM 4.7 million (about 4 sen per share).

.

RUBHD

Show an improved result as compared to last year. There’s still no announcement being made regarding the license migration under WSIA. Last week, the major shareholder RUBHD, Lambang Optima announced that it had just disposed almost all of its holding of RUBHD shares (about 7% of RUBHD total number of share). I still need more time to observe this company.

.

SUPERMX

Continue to show growth in both revenue and profit. The 12-month figures show that its profit margin is almost remained as the previous (2006) level. However, the 4th quarter’s margin falls significantly to about 8.2% only. Recently the share price of Supermx has gone down sharply. I had increase my investment this company, because I'm in an opinion that its current price is very attractive ( PE < 8).

.

TITAN

As expected, EPS for the quarter is only 3.6 sen. The whole year profit has decrease for 13% as compared to 2006. A tax-exempt dividend of 3.0 sen is proposed. Total dividend for the year is equal to 28% of net profit, a bit lower than its announced dividend policy (30% payout rate). Thought the feedstock price has rise to a record high, prospect for the company is still good, as the demand for polymers (especially PE) remain strong. I believe that the shrink in refinery margin is just temporarily. And the Indonesia plant’s production is only 169KT for the year 2007, still below 40% of its capacity. The new butadiene plant will start to generate profit for the company in Q1-2008.

.

03 February 2008

AirAsia: the McDonald’s in aviation industry?

Few days ago, I found that AirAsia’s business model is somewhat similar to McDonald’s -- It is going to generate a huge income from the leasing of aircrafts.

The story of my discovery started from last year, when I realised that I had made a serious mistake in analysing AirAsia -- I ignored the deferred tax item in its financial statement. Since then, I had gone through AirAsia’s financial report again, again, and again, just to make sure that there’s nothing else that I’ve missed.

Then, I discovered an interesting item in the reports —- the aircrafts.

First, let’s introduce two entities that's related to AirAsia -- Thai AirAsia (TAA) and Indonesia AirAsia (IAA). Some people may think that TAA and IAA are subsidiaries of AirAsia. But, in fact, they are not wholly owned by AirAsia. TAA is only a jointly controlled entity of AirAsia, and IAA is an associate company. Both of them started their operation in 2004, and AirAsia only owns 49% stake in each of them. AirAsia had paid USD 5.26 million (about RM 20 million) to get the 49% share of TAA, while IAA’s only cost AirAsia USD 2.00 (two dollars).

Since beginning of their operation, TAA and IAA never own an aircraft. All the aircrafts in operation are either owned by AirAsia, or leased by AirAsia from other parties. AirAsia then lease or sublease these aircrafts to TAA and IAA. They would then, of course, pay a rental fee to AirAsia.

The table below show how much money AirAsia had collected each year, from the leasing of Boeing aircrafts to TAA and IAA. I have included the PBT and Net Cash from Operation of AirAsia in this table, for comparison purpose.

lease

As we can see, the income from leasing aircrafts is quite significant when compared to AirAsia’s PBT, or operational cash.

However, the actual earning from these leasing activities should be quite small, because most of these aircrafts are not owned by AirAsia. (The company only owns six Boeing aircrafts). AirAsia lease the Boeings from other party and sublease them to TAA or IAA. I don’t think AirAsia can make a good profit out of this.

But in the next few years, AirAsia’s fleet size will grow dramatically. Due to the latest information, it has 175 confirmed order of Airbus. According to the current planning of AirAsia's management, more that half of these aircrafts will be leased to TAA or IAA. Then, the rental income may have a great contribution to AirAisa's profit.

This is similar to what McDonald’s did about 50 years ago. In the early stage of its expansion, McDonald’s signed long-term lease-contracts with some property owners to rent their properties, and then subleased those properties to its franchisees. Later, while McDonald realized the great potential of rental income, it started to buy its own properties. Then, the rental income had gradually become the most important part of its profit.

So, while AirAsia's fleet size is expanding, will the rental income (of aircraft) gradually play an important role in AirAsia's profit?

Well, maybe it's too early to make a conclusion now. Let's wait and see......

.

18 January 2008

the WSIA and RUBHD

Water Service Industry Act 2006

The Act was enforced on 1 January 2008. The enforcement of this Act is a step taken by the Federal Government to reform the water service industry in our country. (However, water service industry of Sabah & Sarawak are not included in the plan).

Two new bodies have been formed in this restructuring program, namely SPAN (Suruhanjaya Perkhidmatan Air Negara) and PAAB (Pengurusan Aset Air Bhd).

This program has very important effect on the industry. Some of them are:

  • The Federal Government takes over control and regulation of water supply and sewerage services from States.
  • All existing water supply services run by State Governments will be corporatised.
  • A national Water Services Commission, SPAN was be set up to regulate the water services industry.
  • a Water Assets Management Company (the PAAB) was formed to:
    • Take over State Water existing assets and Federal loan liabilities
    • Fund and develop water supply infrastructure
    • Leased back to water service providers existing & new assets.

There will be no more new privatised concessions after WSIA. New operators will be granted licenses by SPAN. Unlike the long-term concession agreements, the licenses are renewable upon application and approval of SPAN.

(for more information, please visit http://www.span.gov.my/)

For those existing concessionaires, they may have an option to retain their existing concessions or to migrate to the new license.

(According to the announcement by RUBHD on November 2007, its subsidiary SAJH is actively assesing the migration option.)

.

The possible impact on RUBHD, should it chooses to migrate into the new liscense.

After the migration, SAJH may loss the advantages of being a concessionaire. Under the new scheme, the license is renewable subjected to the approval of SPAN. While the possibility is small, the water supply business of SAJH in Johor may be taken over by some other parties. Thus, RUBHD may face some competitions from the other companies, e.g. Syabas and Puncak Niaga.

On the other hand, the operational cost may increase due to the leasing fees of the water assets from PAAB. And, unlike the privatization cocession, tariff reviews from the new liscensees will be based on applications which need to be substantiated by each licensee. (It means there will be no more "automatic tariff increase"). These may affect the profitability and future growth of RUBHD.

These are the uncertainties that worried me last year, and stopped me from accumulating RUBHD shares. Because, the monopoly nature of its business and the scheduled tariff hike were the main reasons that made me investing in RUBHD.

However, recently I had found that there’s also some positive impacts on RUBHD if SAJH chooses to migrate into the new licensing regime.

After transferring all its assets (with the associate debts) to PAAB, SAJH will become an asset-light company, and become more concentrate on its operations. At the same time, SAJH will free itself from the commitment of huge CAPEX in the future. Thus it will not need to keep a big amount of cash in the company.

This will unlock the equity value of RUBHD and allow the company to distribute its earnings to the share holders through dividend payments. I’m confident that the future dividend yield of RUBHD will be a quite satisfactory one.

And, according to its current financial condition (cash-per-share > RM2.00), there’s a high possibility that RUBHD will declare a special dividend or capital distribution, soon after the migration.

.

13 January 2008

Reasons investing in RUBHD

I discovered Ranhill Utilities Berhad few months ago.

It was an incident. A friend gave me a “tips” that a stock named Ranhill would go up very soon, and ask me to buy the stock. So, I went through its annual reports, then found that it was a conglomerate involves in various sectors ranger from construction to power generation plant. But after a short analysis, I immediately found that majority of its income is actually generated from one subsidiary—Ranhill Utilities Bhd, a company which is also listed on KLSE.

Then, my interest was switched to this RUBHD. After some research on the nature of its business, I then found that it is a good candidate for value investing, and also for long term investment.

My conclusion is just based on the reasons stated below:

1. Monopoly Business

RUBHD main income is from its subsidiary named SAJH, which hold a Concession Agreement with Johor’s State Government to supply water to the consumers in the state. The concession period is 30 years (from 2001 to 2029). Obviously, this is a stable, monopoly business. Thus, RUBHD doesn’t have any risk from competition or lost of market share.

2. Guaranteed Return

The following passage is taken out from RUBHD’s Financial Report FY-2007, page 97.

"According to the CA, the supply of treated water is charged in accordance to the Scheduled Tariff (water supply tariff to be charged by SAJH for a particular purpose or class of consumers), provided that the SAJH’s Internal Rate of Return (“IRR”) is within the Agreed IRR Band of 14% to 18% over the Concession Period. The Scheduled Tariff is to be submitted to the State Government for approval. The Agreed Tariff (approved Scheduled Tariff) will be gazetted and shall take effect for the applicable operating period on the relevant Tariff Adjustment Dates. The Tariff Adjustment Dates agreed with the State Government are as follow:

(i) First Tariff Adjustment Date – effected on 1 January 2001;

(ii) Second Tariff Adjustment Date – effected on 1 July 2003;

(iii) Third Tariff Adjustment Date – effected on 1 January 2007; and

(iv) Subsequent Tariff Adjustment Dates – scheduled on 1 January 2009 and thereafter at 36 monthly intervals till 2029.

In the event the gazetted tariff is lower than that of the Agreed Tariff, or in any other event the Agreed Tariff was not adopted, the State Government shall compensate SAJH in accordance with a formula as specifi ed in the CA. "

Isn’t this show that the RUBHD has a stream of income which is guaranteed by the State Government?

3. Attractive share price.

RUBHD’s earning per share for FY-2007 is about 70sen. This means that its share is currently trading at a PE value of 4, which is quite attractive.

Besides that, RUBHD’s current share price (RM2.80) is lower than its equity per share. According to its latest report, RUBHD equity per share is about RM3.50, and there is a large amount of cash in the company—its cash per share is about RM2.10. So, I think buying RUBHD at its current share price has a very low risk.

.

Based on the stated reasons, I’d decided to invested some money in RUBHD. At the same time I continued my research on its industry. Then I found that there’s a restructuring scheme coming up soon, which will change the business environment of the water service industry in our country. It is the new Water Service Industry Act (WSIA), which would be in forced at the last quarter of 2007.

This has added some uncertainty to the prospect of SAJH. So, I decided to stop buying RUBHD until I can figure out the effect of this Act on the company. After some studies in these few months, now I’ve gain some understanding about WSIA. I’ll discuss it in my next post.

.

02 January 2008

My Portfolio at 31-Dec-2007

Here's the combination of my investment at the end of 2007.

(click the photo for full size view)

Portfolio 2007-12-31

* the buying cost is adjusted for dividend received, and trading fee (brokerage fee) is included in the cost.

Comment:

AKN is my short-term holding. The main reason I bought it is because its price is below its value. I'll sell it anytime when the price is going back to a normal level (e.g. when PE = 10.)

Titan is a medium-term investment, my aim is waiting for its price to shoot up to RM2.50 while enjoying its tax-free dividend. I'm in the opinion that the upward cycle of petrochemical industry will continue until 2010 or 2011. I never worried about the short-term volatility of its share price. However, I think maybe I shouldn't put too much money on this stock at the begining. (about 33% of my total cost is invested in Titan, this is quite a high portion.)

RUBHD is a good stock I discovered half-year ago. But later I found that it will undergo a restructuring process under the Water Service Industry Act 2006 which will take effect on the end of 2007. The uncertainties of this restructuring make me stop accumulating RUBHD. I'll discuss this in the future post.

My initial expectation when investing in AirAsia, is to hold this stock for a very long-term. But now I realise that I've made a mistake in calculating its income. So, I need more time to observe it.

Supermax is another stock that I plan to hold it for long-term. I'll keep an eye on it and continue to observe the effect from its merger with Seal Polymer.

I still got a small amount of cash. Now I'm waiting for the some announcement from SC to clearify the brokerage fee of online-trading. If the minimum fee still remain the same (RM12), then I'll probablly invest this cash into 2 or 3 different stocks, to achieve a more diversified portfolio (the Graham's approach). Else, this money will go into a single stock, maybe RUBHD.

Related Posts Plugin for WordPress, Blogger...


SPONSORS: